Assets
In Amorphic BI, the primary resources of interaction—including Analyses, Dashboards, and Topics—are collectively managed as Assets. These assets represent the fundamental entities within your analytical workspace, granting users with the appropriate permissions full administrative control over their lifecycle.
Within the BI interface, you can perform a range of operations on these resources, such as refining data visualizations, managing collaborative permissions, and executing structural updates to maintain an organized and efficient reporting environment.
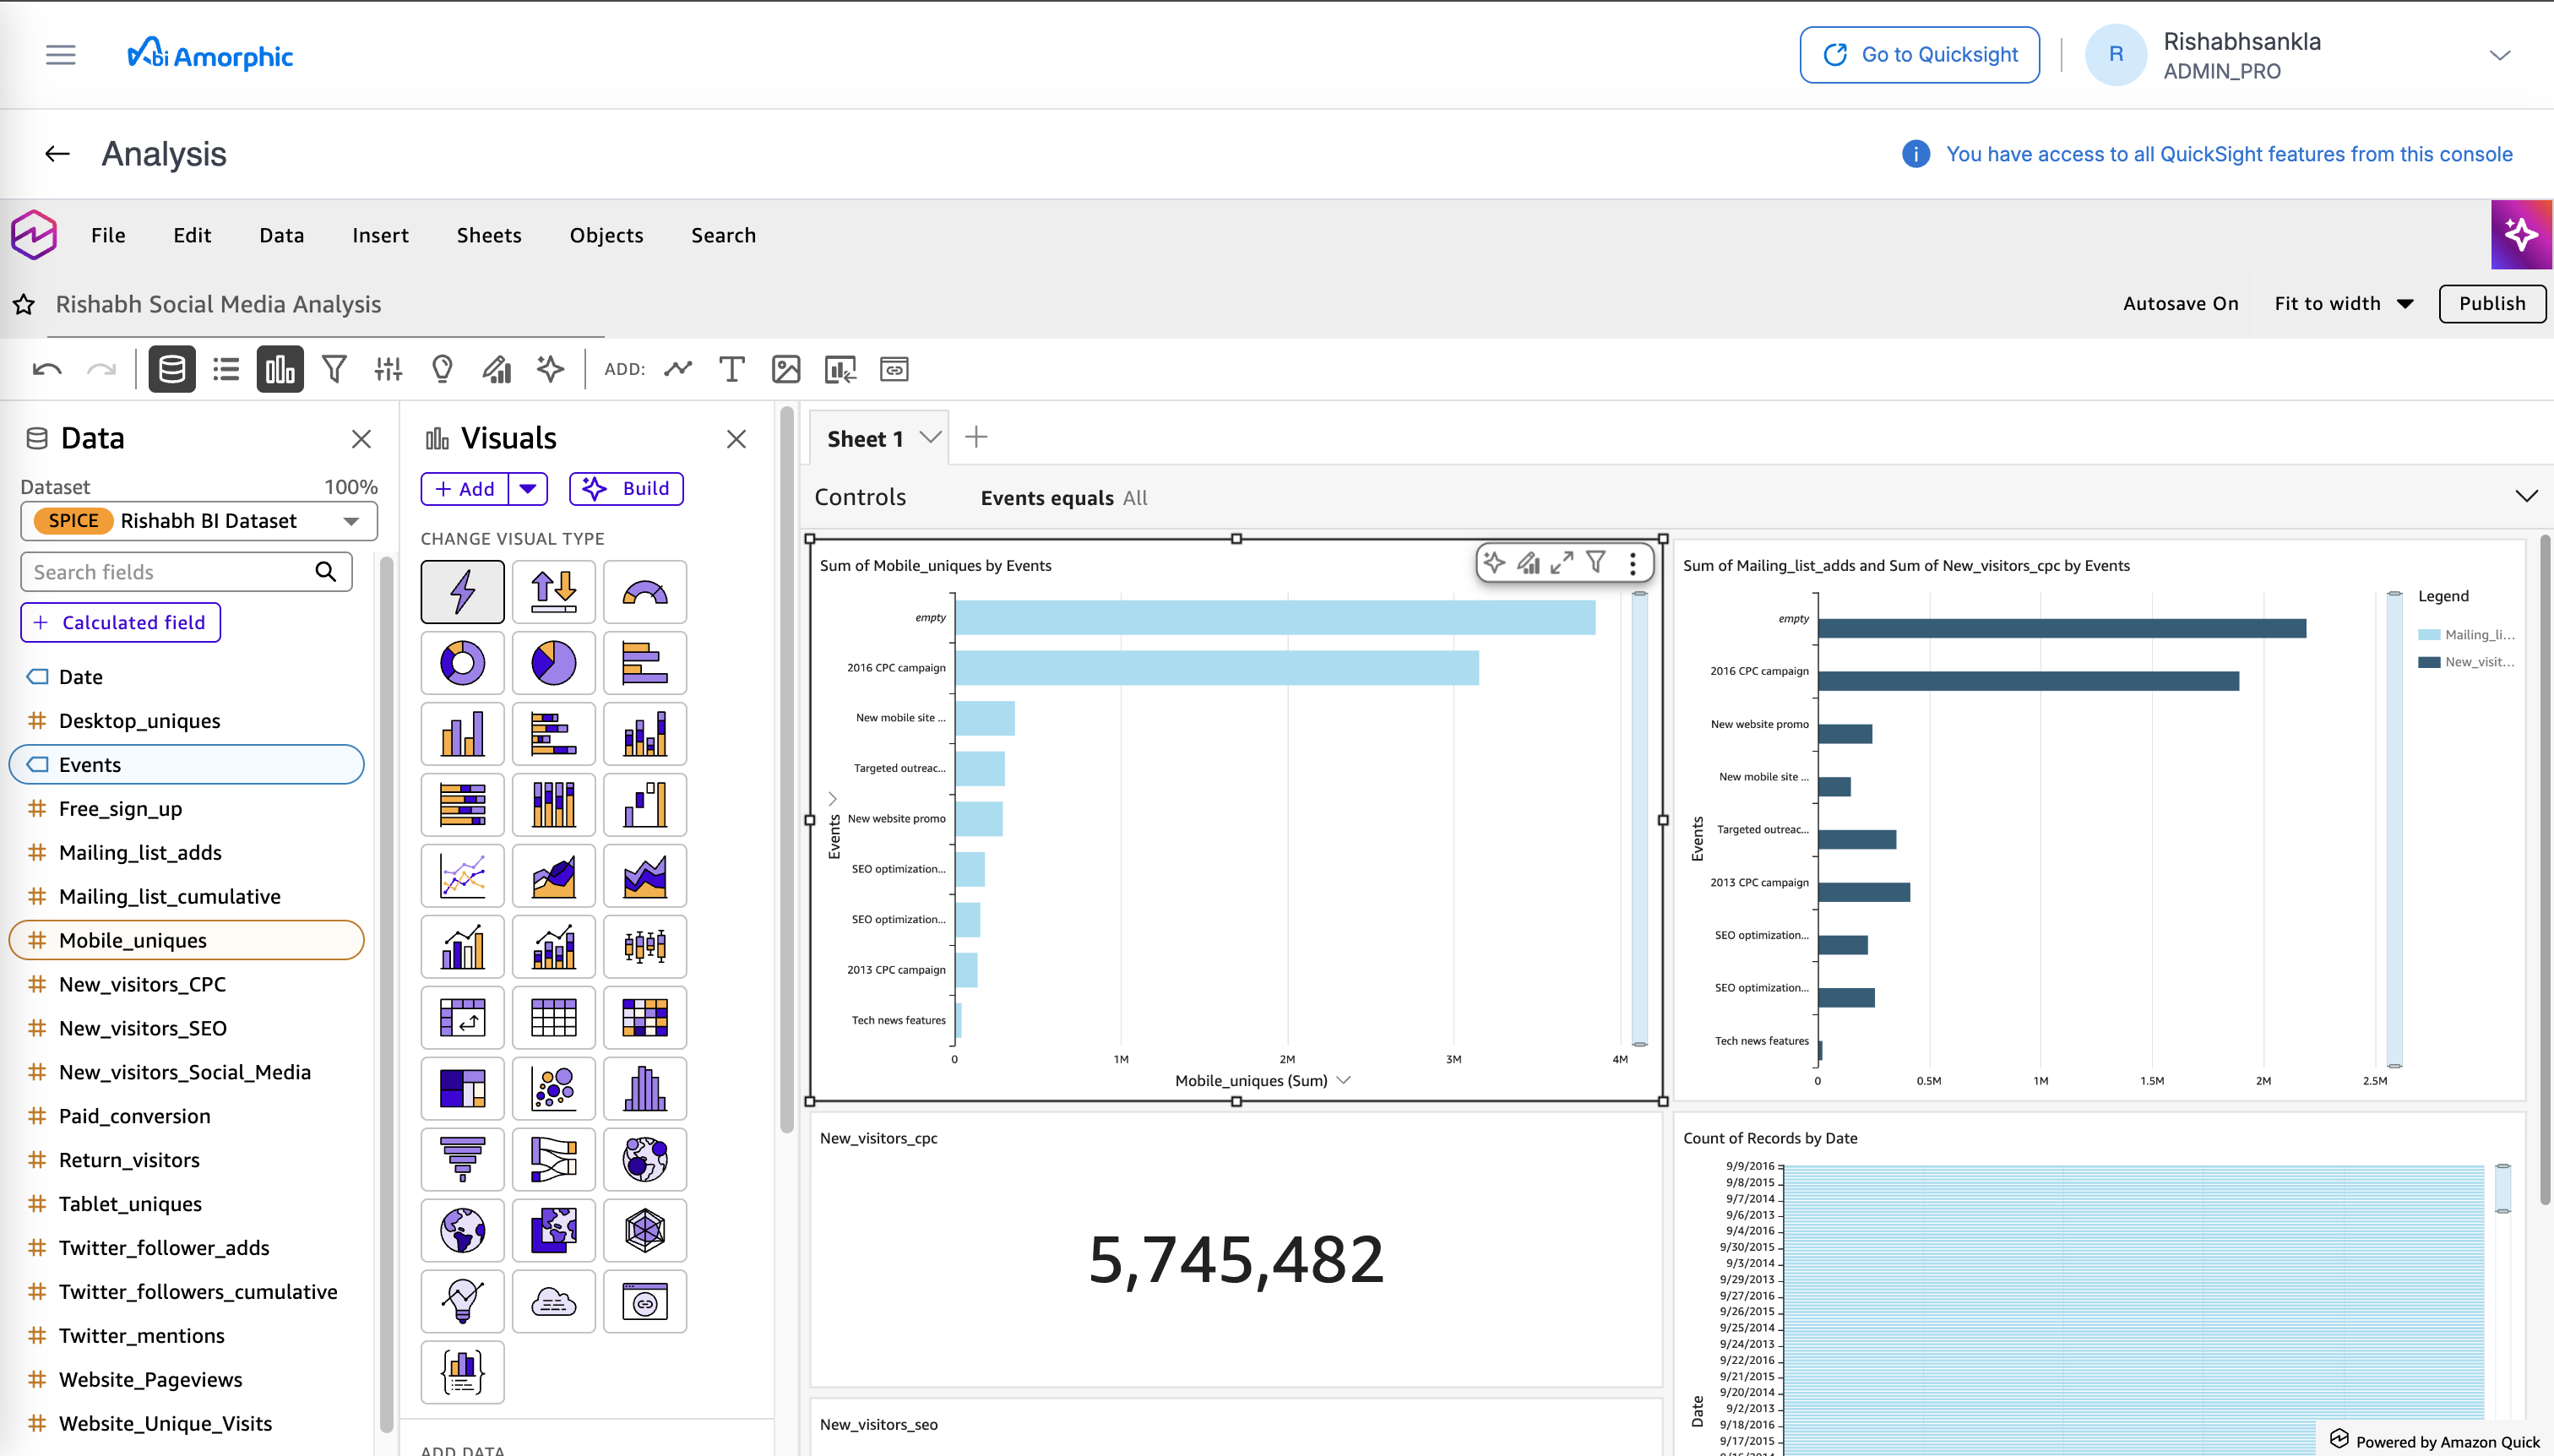
Analyses
In Amorphic BI, an Analysis serves as your primary workspace for data exploration and visualization. It is the development layer where you transform raw datasets into interactive charts and graphs, allowing for deep-dive investigation into business trends.
Because an Analysis is a private "drafting" environment, you can experiment with different visual types and calculated fields without affecting the final reports viewed by other stakeholders. Once your insights are refined, the Analysis acts as the source file used to publish static Dashboards for broader consumption.
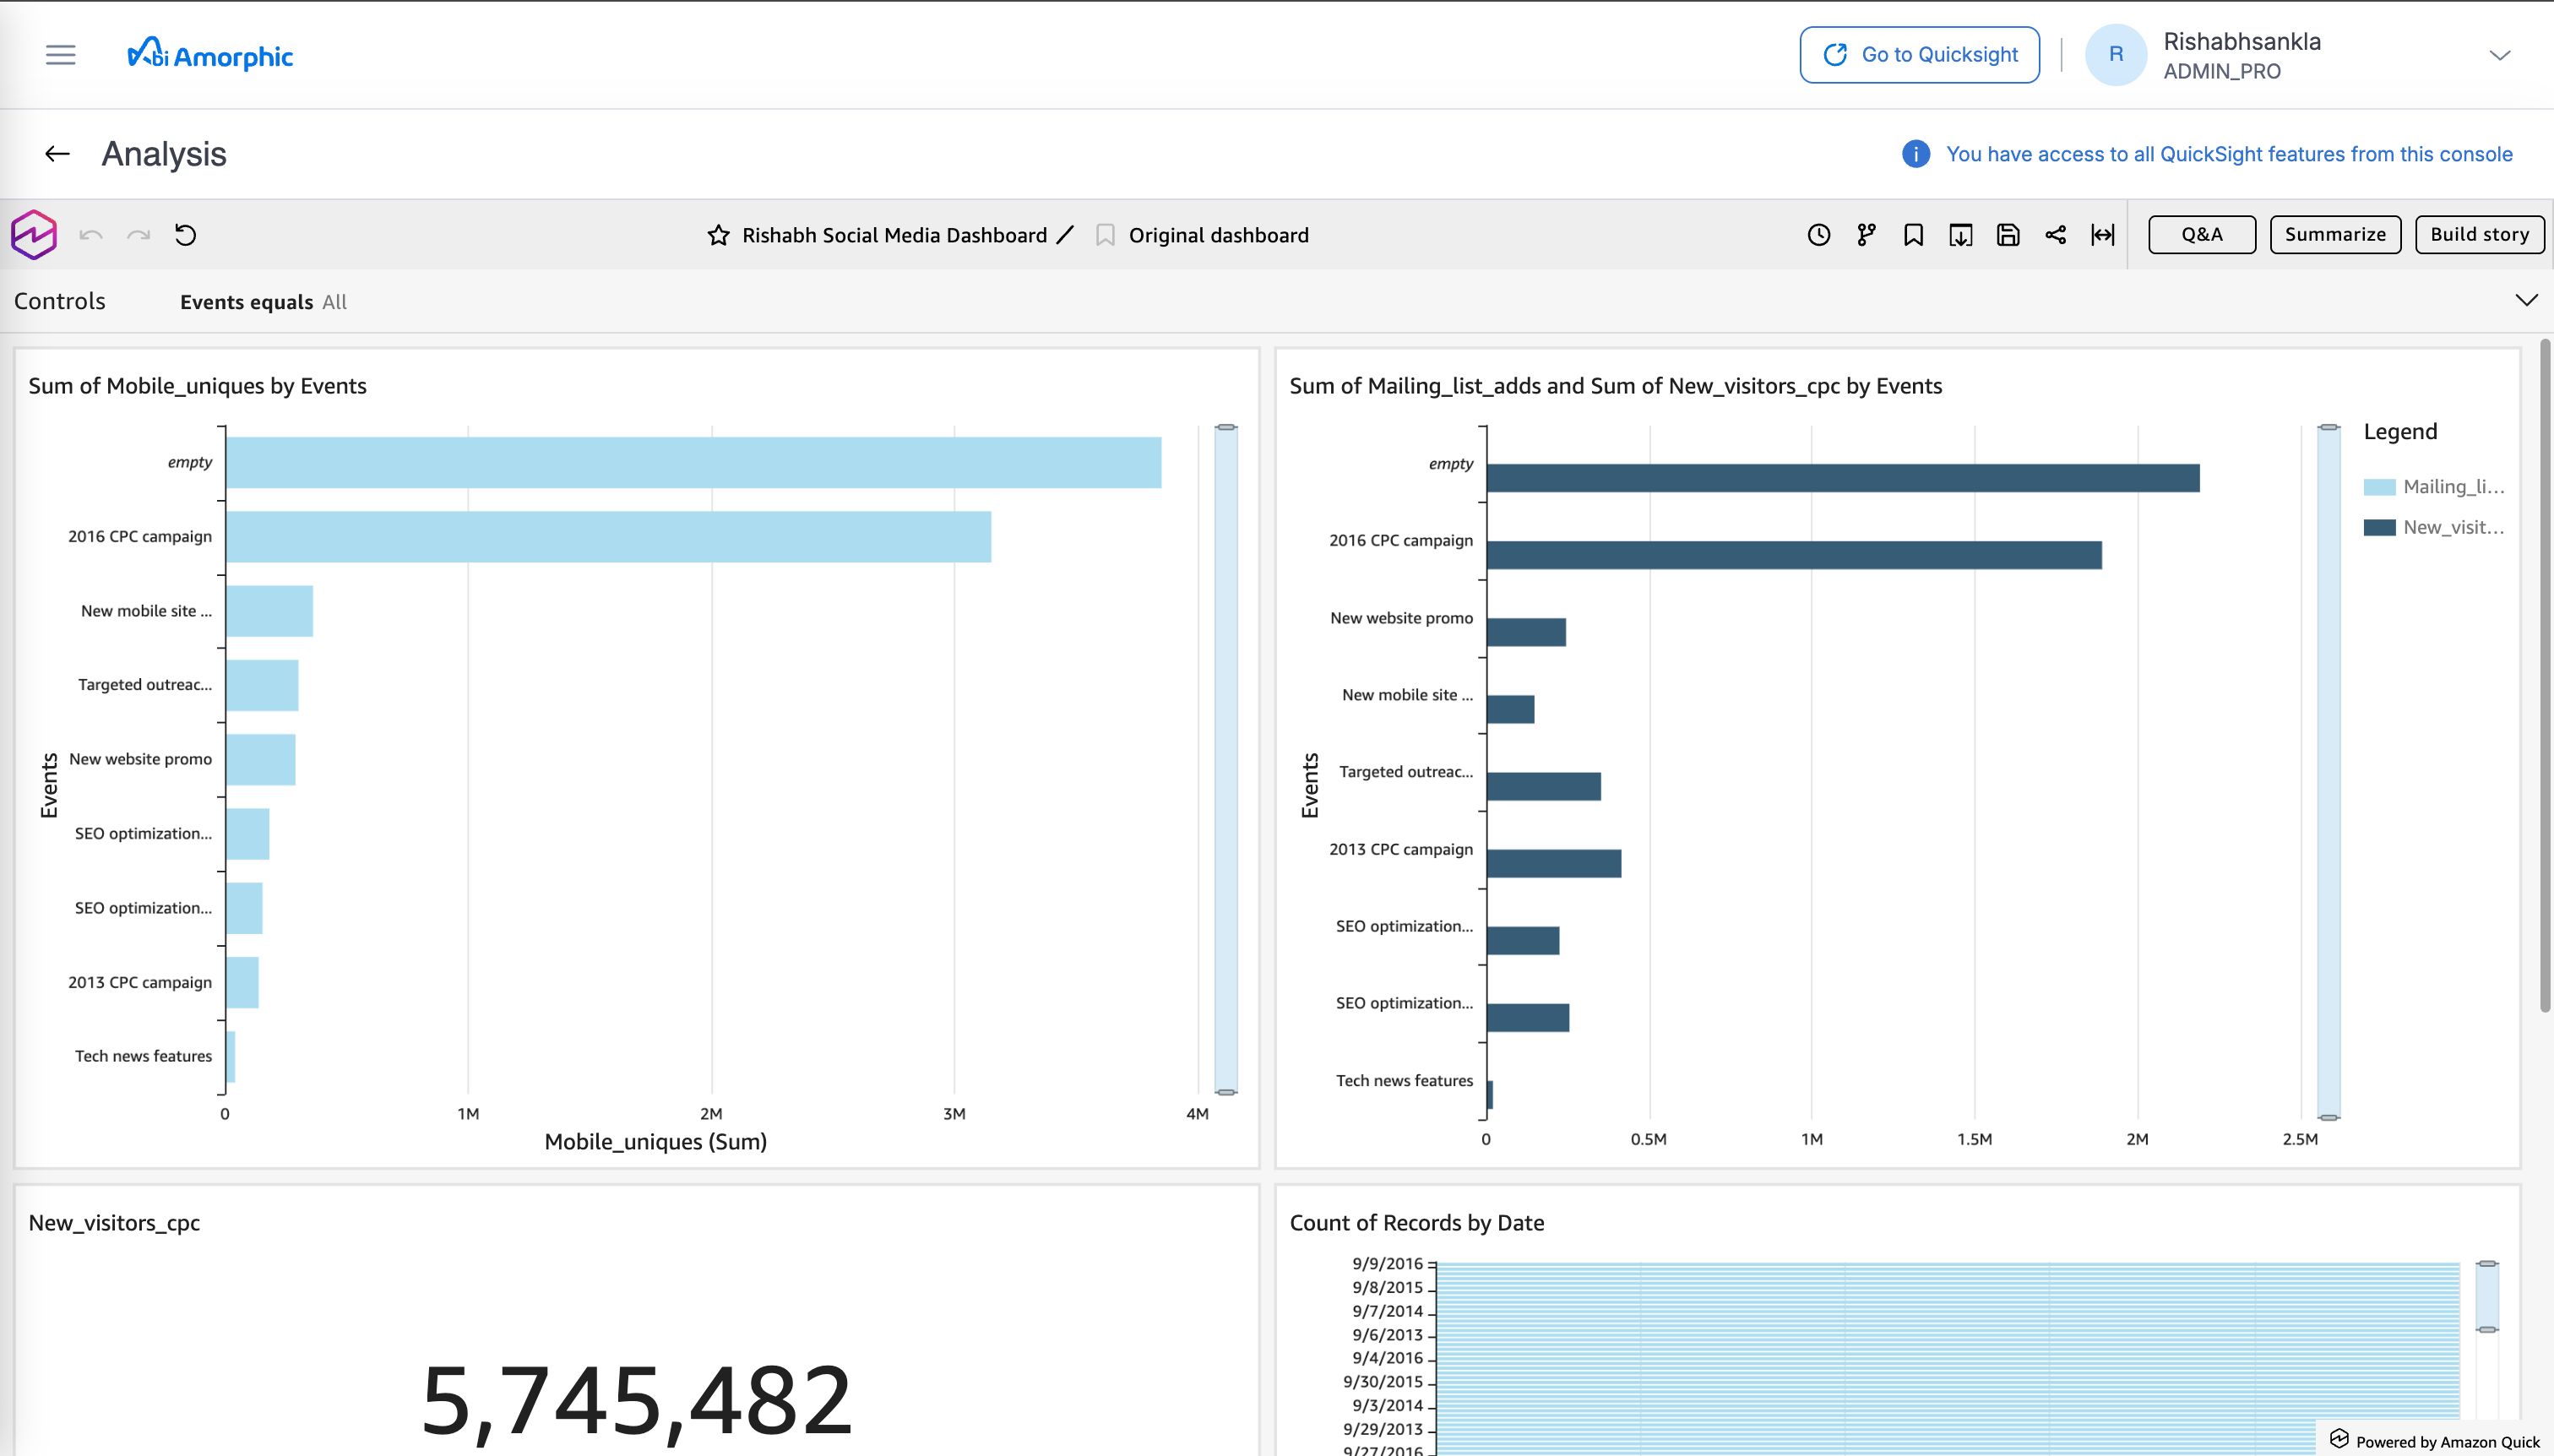
Dashboards
A Dashboard is the read-only, published version of an Analysis. In the Amorphic BI ecosystem, Dashboards serve as the primary vehicle for sharing insights with stakeholders and decision-makers. Because a Dashboard is inherently derived from a parent Analysis, it preserves the visualizations and logic you developed while stripping away the editing interface—ensuring end-users interact with a clean, high-performance interface designed for monitoring KPIs and viewing reports, while the underlying data structure remains protected from accidental modification.
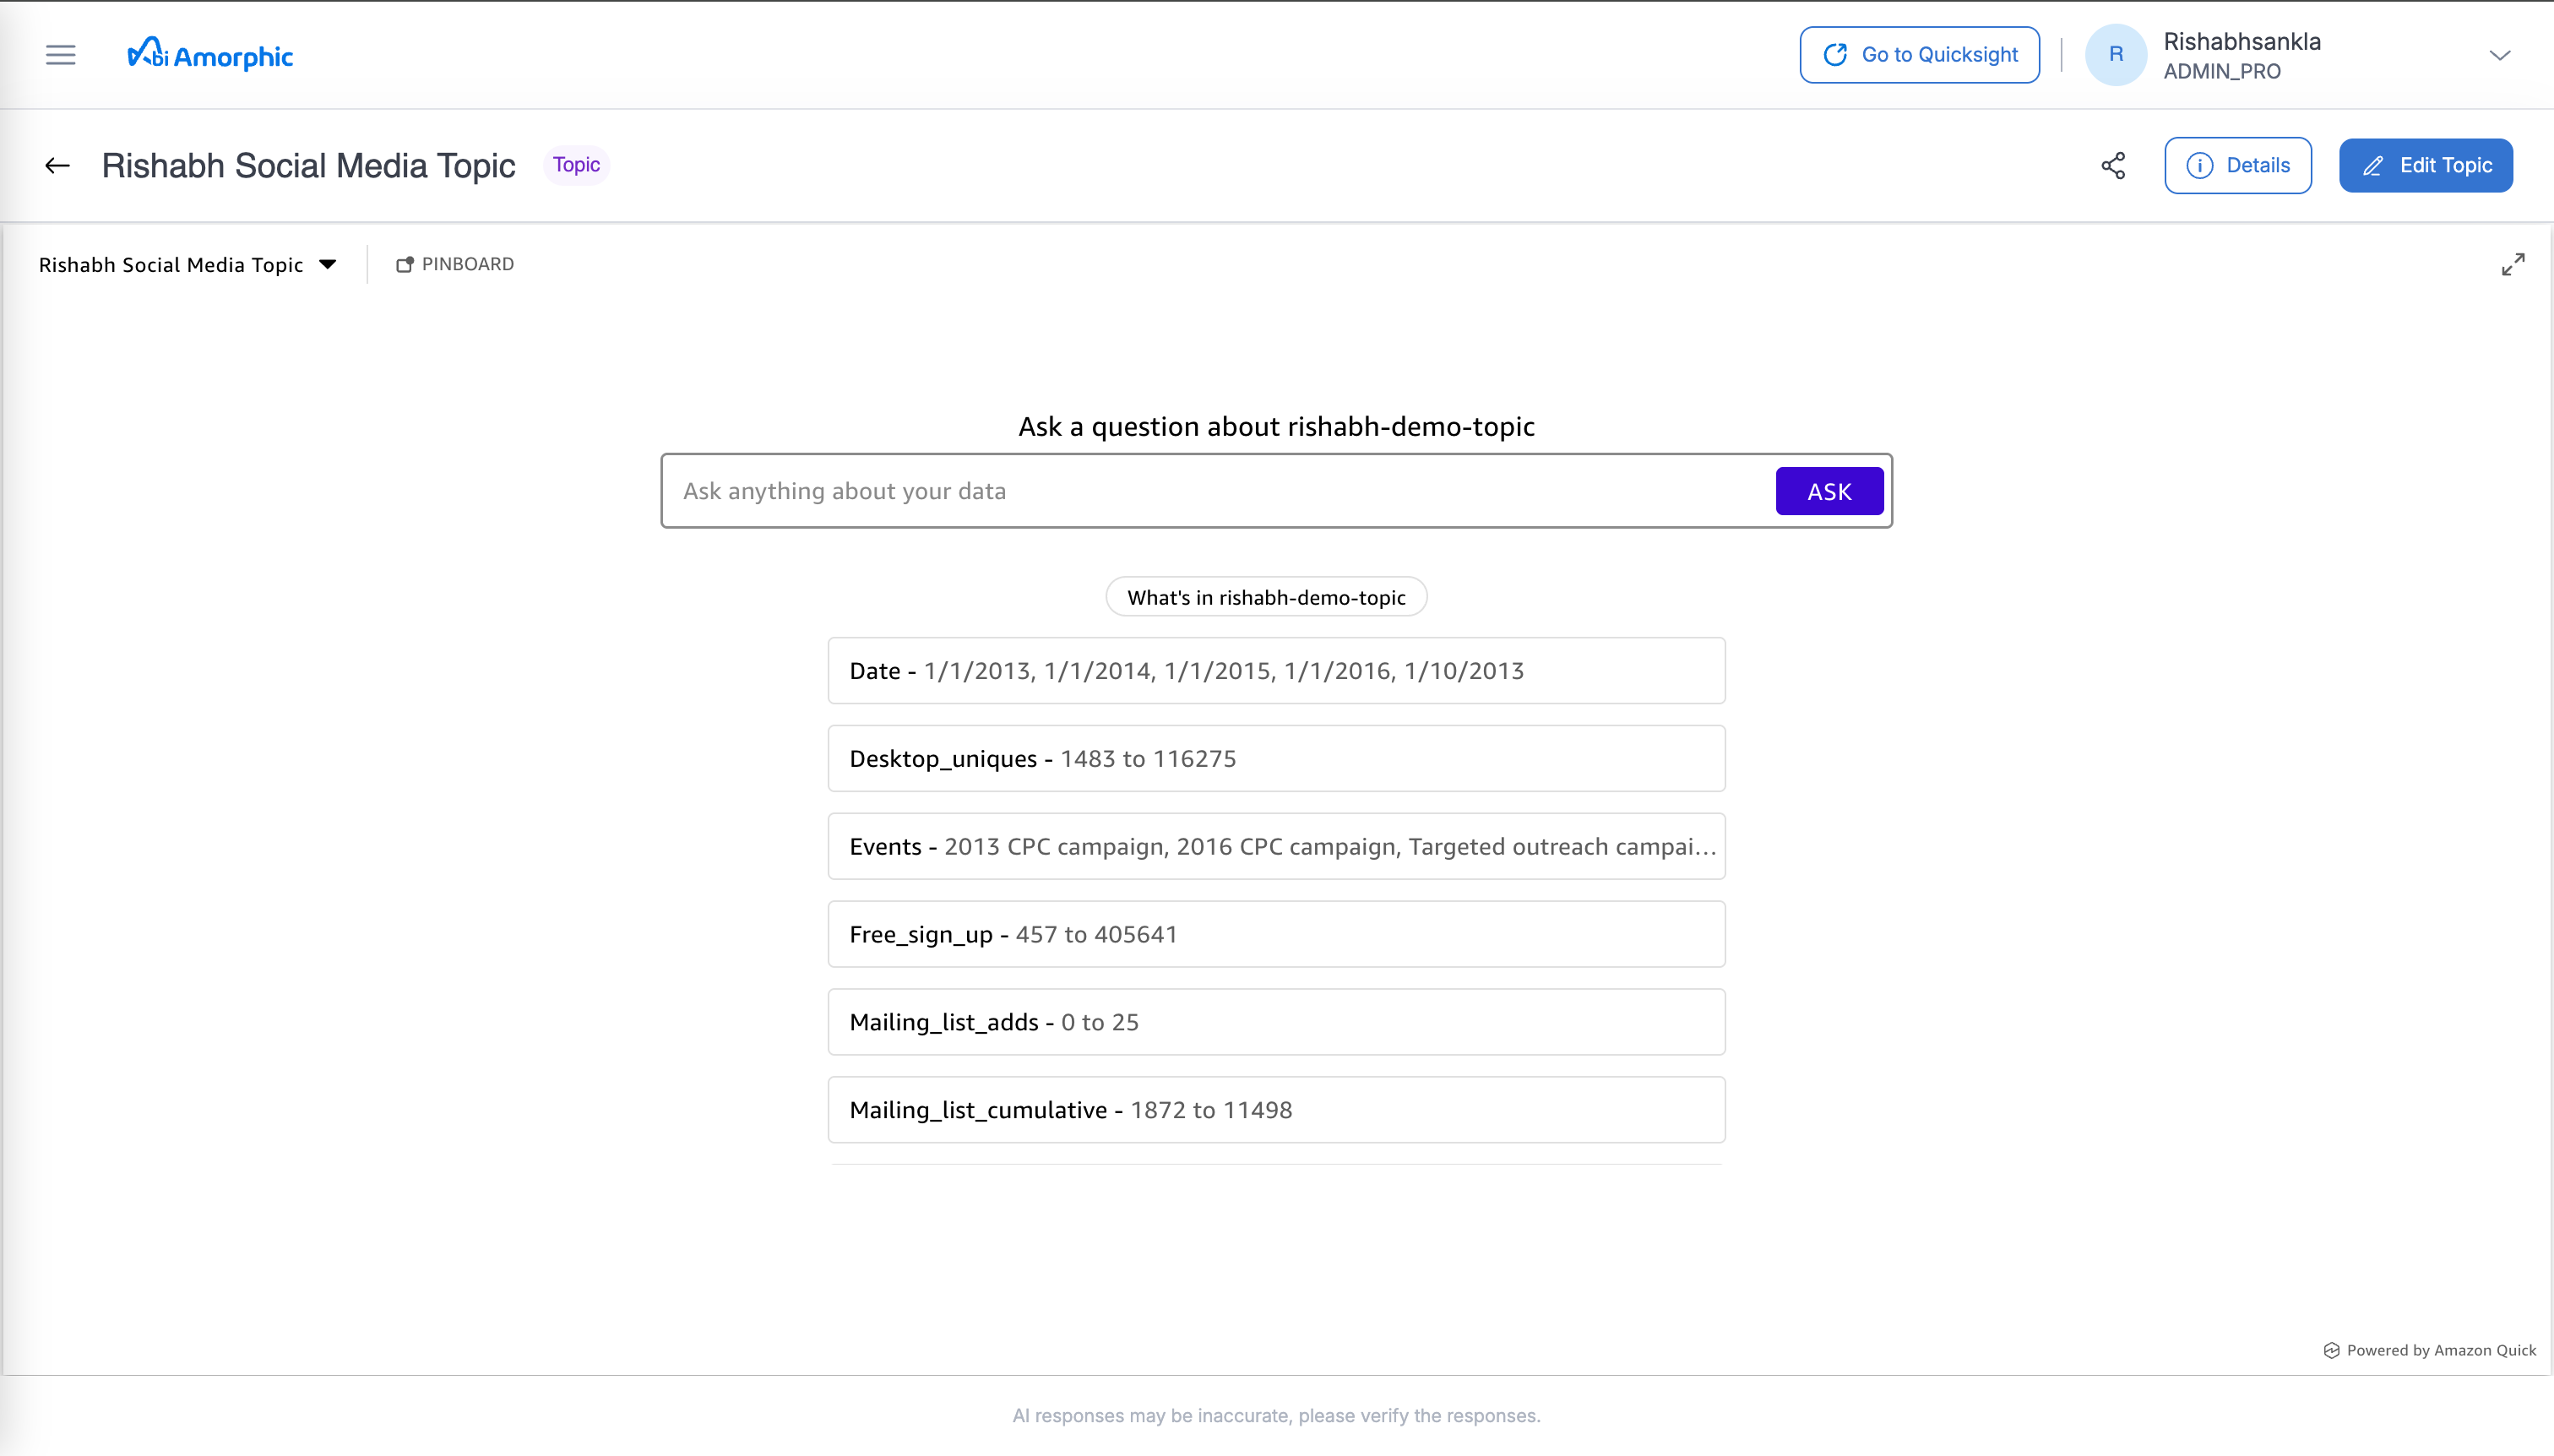
Topics
Topics represent the natural language layer of Amorphic BI, designed to power conversational data discovery. Unlike traditional visual assets, a Topic is a curated collection of data and metadata that "teaches" Amazon Q how to interpret specific business terms and relationships. By configuring a Topic, you enable users to bypass manual report building and instead gain insights by simply asking questions in plain English. This asset acts as the intelligence bridge, translating user intent into precise data queries that return immediate, relevant answers.