
Asset Management
Asset Management allows you to oversee the lifecycle of your analytical content within the Analytics Studio. While Data Entities provide the foundation, Assets represent the interactive and visual layer where data is transformed into actionable insights. Through the native interface, you can manage the creation and distribution of Analyses, Dashboards, and Topics, ensuring your team has access to the most relevant business intelligence.
If an Amorphic account has a high volume of datasets, the associated IAM policy may exceed its character limit, resulting in an error. To resolve this, you must manually grant dataset-level access (DLA) to the specific user encountering this issue to ensure they can continue managing assets without interruption.
Analyses
Analyses serve as the primary interactive workspace where you transform raw data into visual stories. This environment allows you to perform deep-dive data exploration, apply filters, and build complex visualizations to identify trends and patterns. Once your insights are refined, an analysis acts as the definitive draft that can be published as a static dashboard for broader organizational consumption.
Create an Analysis
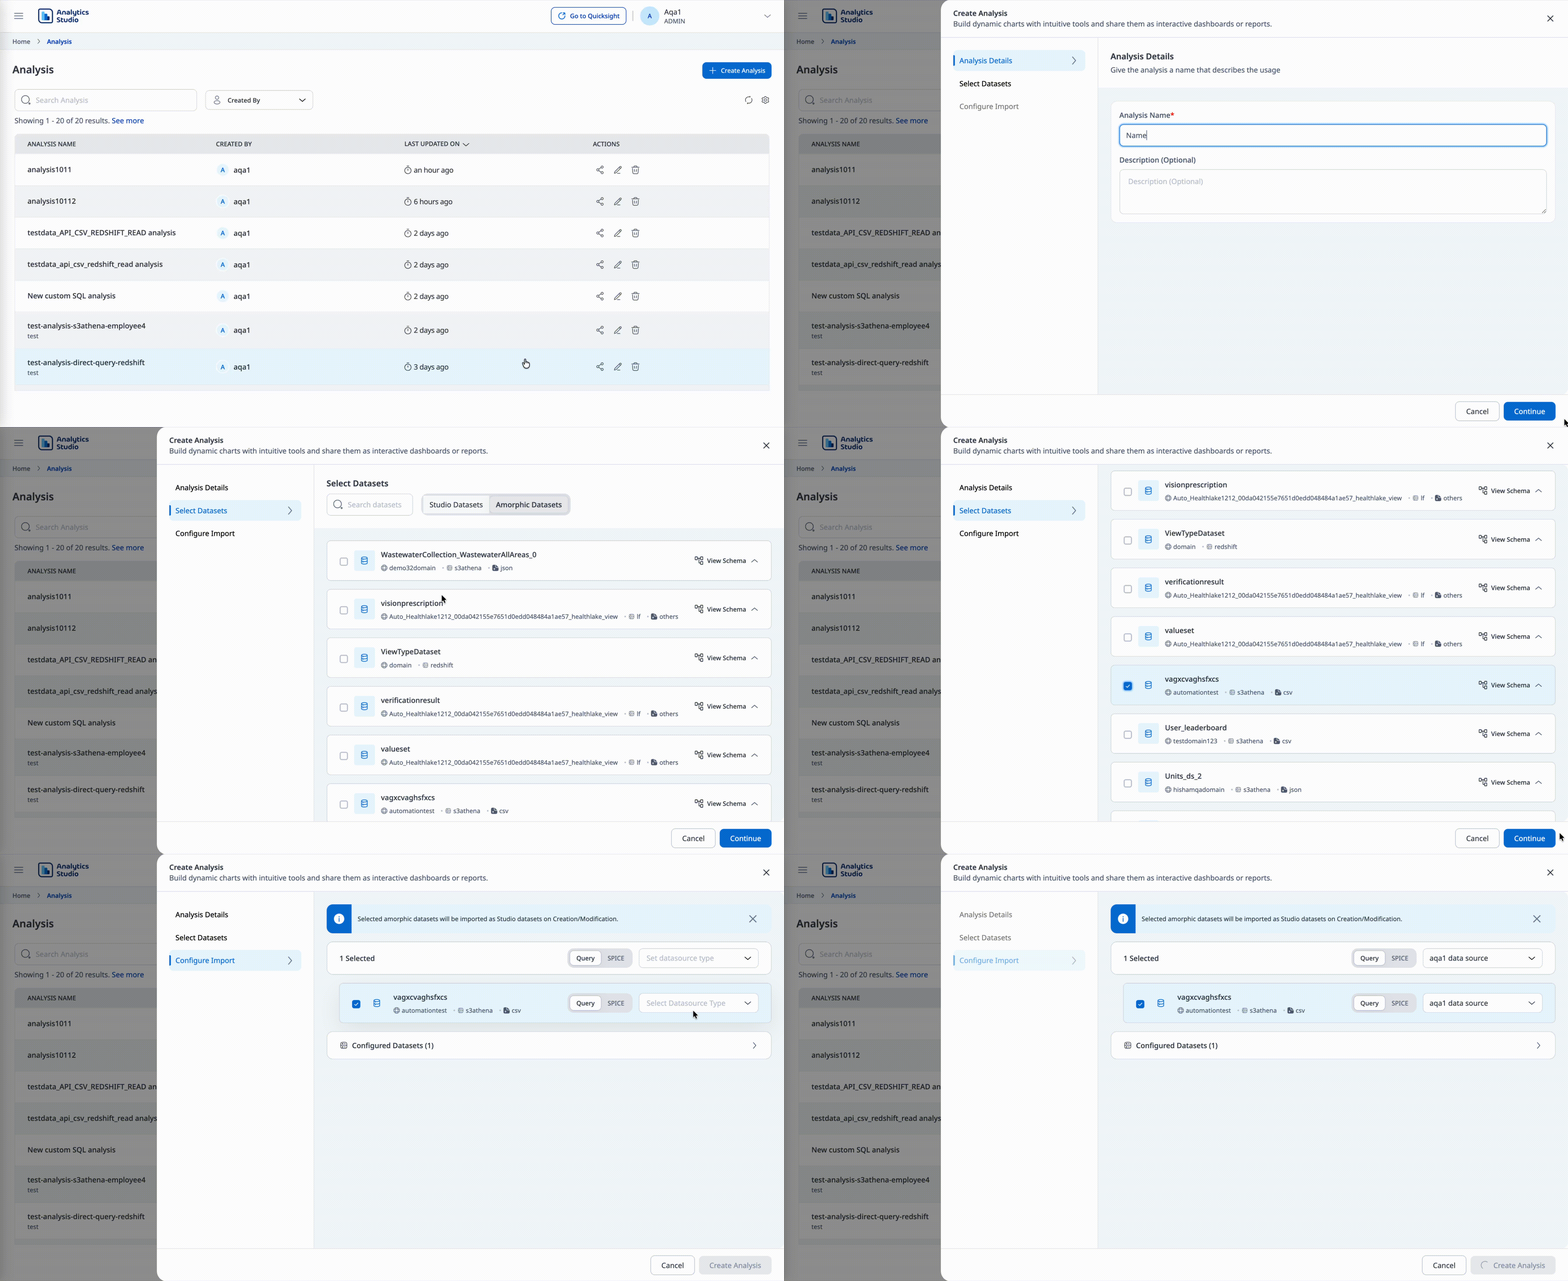
To create an analysis in the Studio, follow these steps:
- From the Homepage or the Analysis page, click the
Create Analysisbutton. - Enter a name and an optional description for your analysis.
- Select datasets for the analysis. You can choose:
- Amorphic datasets, or
- Analytics Studio datasets that already exist in the application.
- If you select an Amorphic dataset, choose a datasource for it:
- Lake Formation and S3 Athena datasets support only the default Athena datasource.
- Redshift datasets allow you to select from already created Redshift datasources.
- Click Create to launch the analysis interface.
Update an Analysis
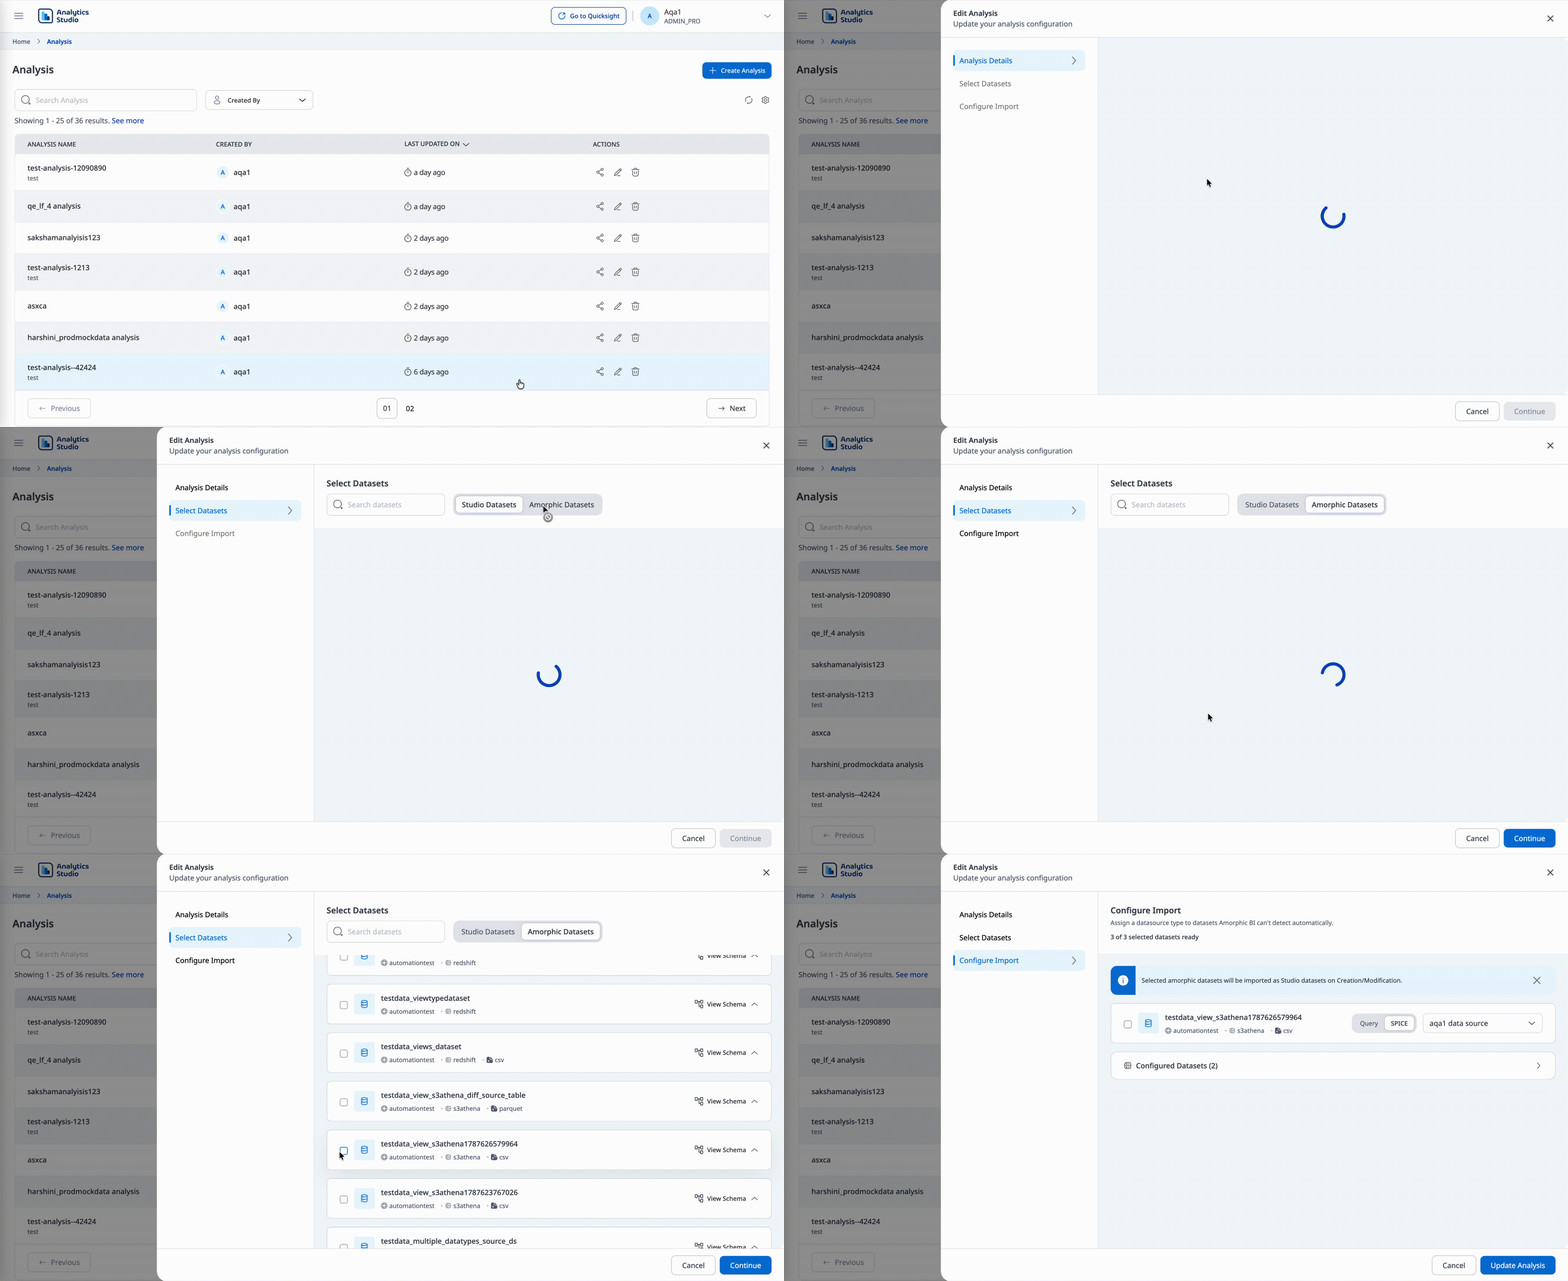
To modify an existing analysis, click the 'Edit' () icon next to the asset. Within the editor pane, you can manage your analysis data by selecting more or replacing datasets to adjust the underlying information powering your visuals.
Dataset selection during update follows the same rules as creation:
- Choose Amorphic datasets and/or already created Analytics Studio datasets.
- For each selected Amorphic dataset, choose a datasource:
- Lake Formation and S3 Athena datasets support only the default Athena datasource.
- Redshift datasets allow you to select from already created Redshift datasources.
Delete an Analysis
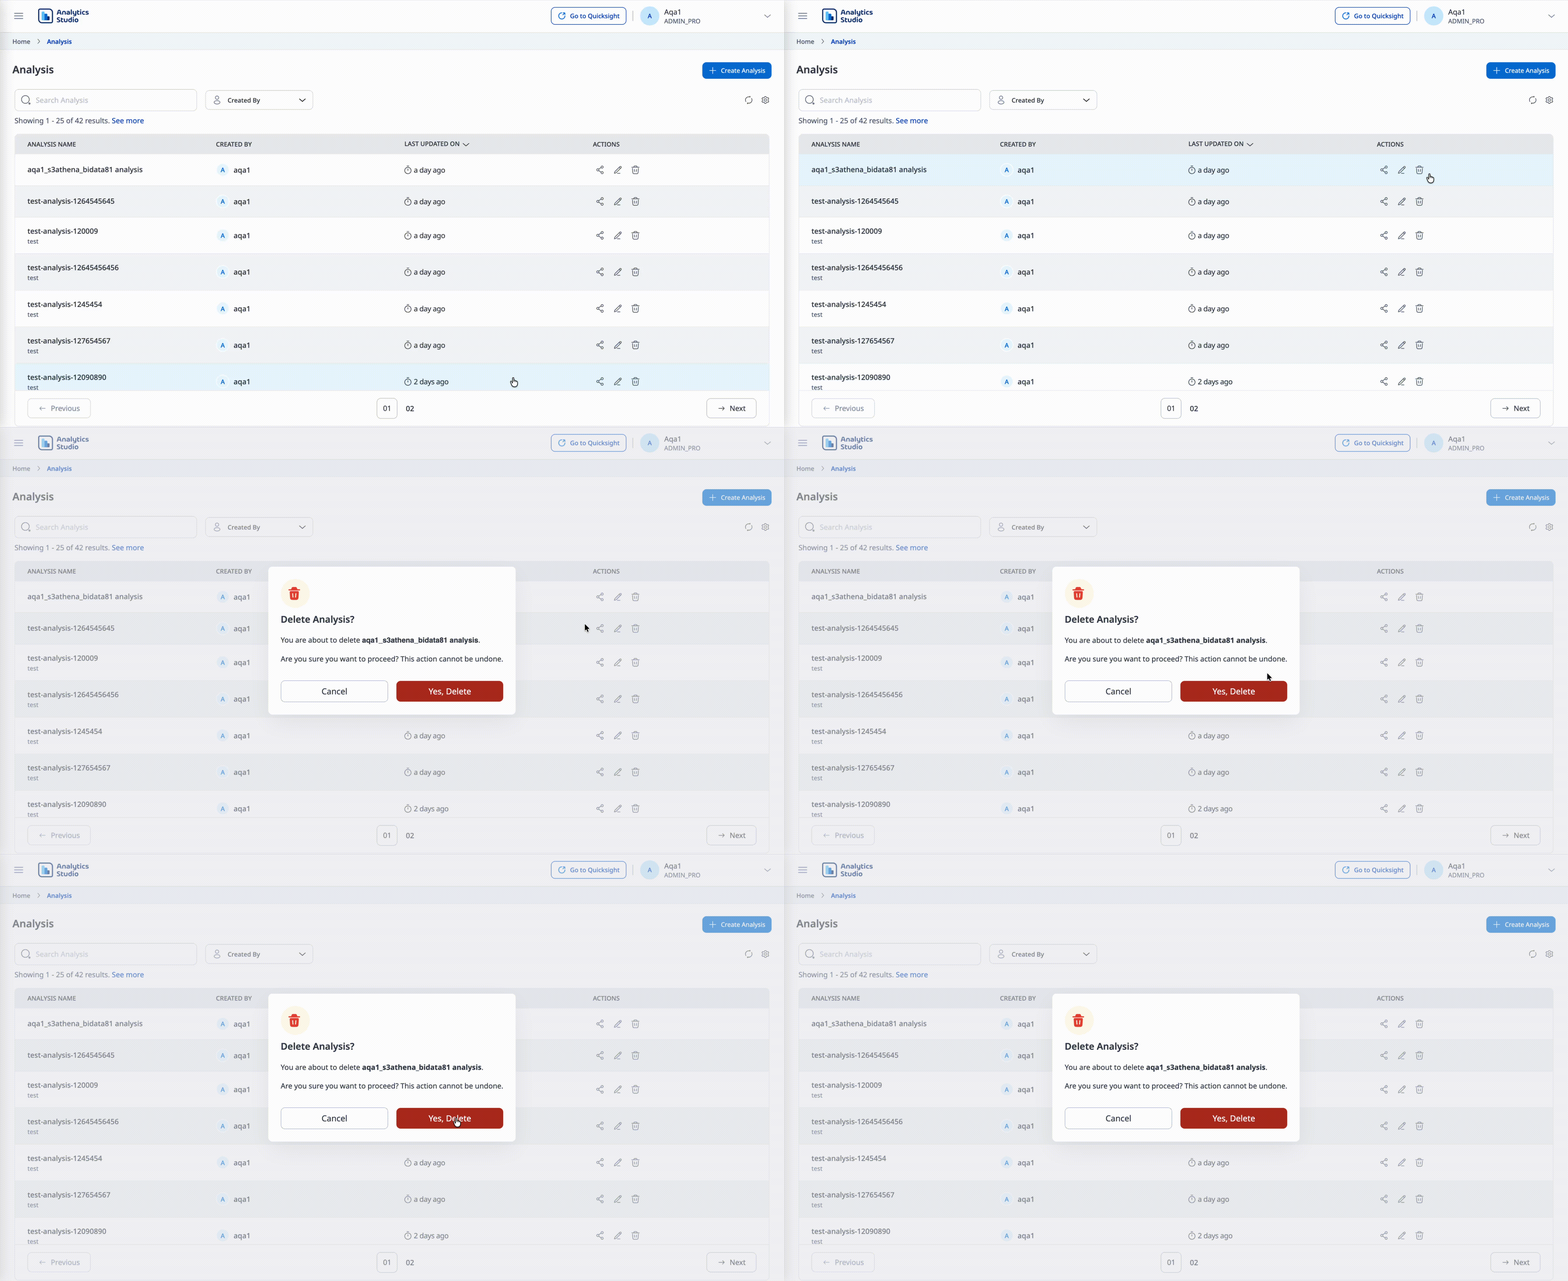
To permanently remove an analysis, click the Delete () icon next to the asset name, and click on the Yes, Delete button to proceed with the deletion.
Dashboards
Dashboards act as the secure, read-only distribution layer for your insights, providing a finalized view of your data for stakeholders and decision-makers. Unlike the interactive exploration found in Analyses, Dashboards are optimized for high-performance consumption, allowing users to view pre-configured visualizations without the risk of altering the underlying logic. They serve as the "single source of truth" for your business metrics, ensuring that everyone in the organization is aligned on the same data-driven conclusions.
Create a Dashboard
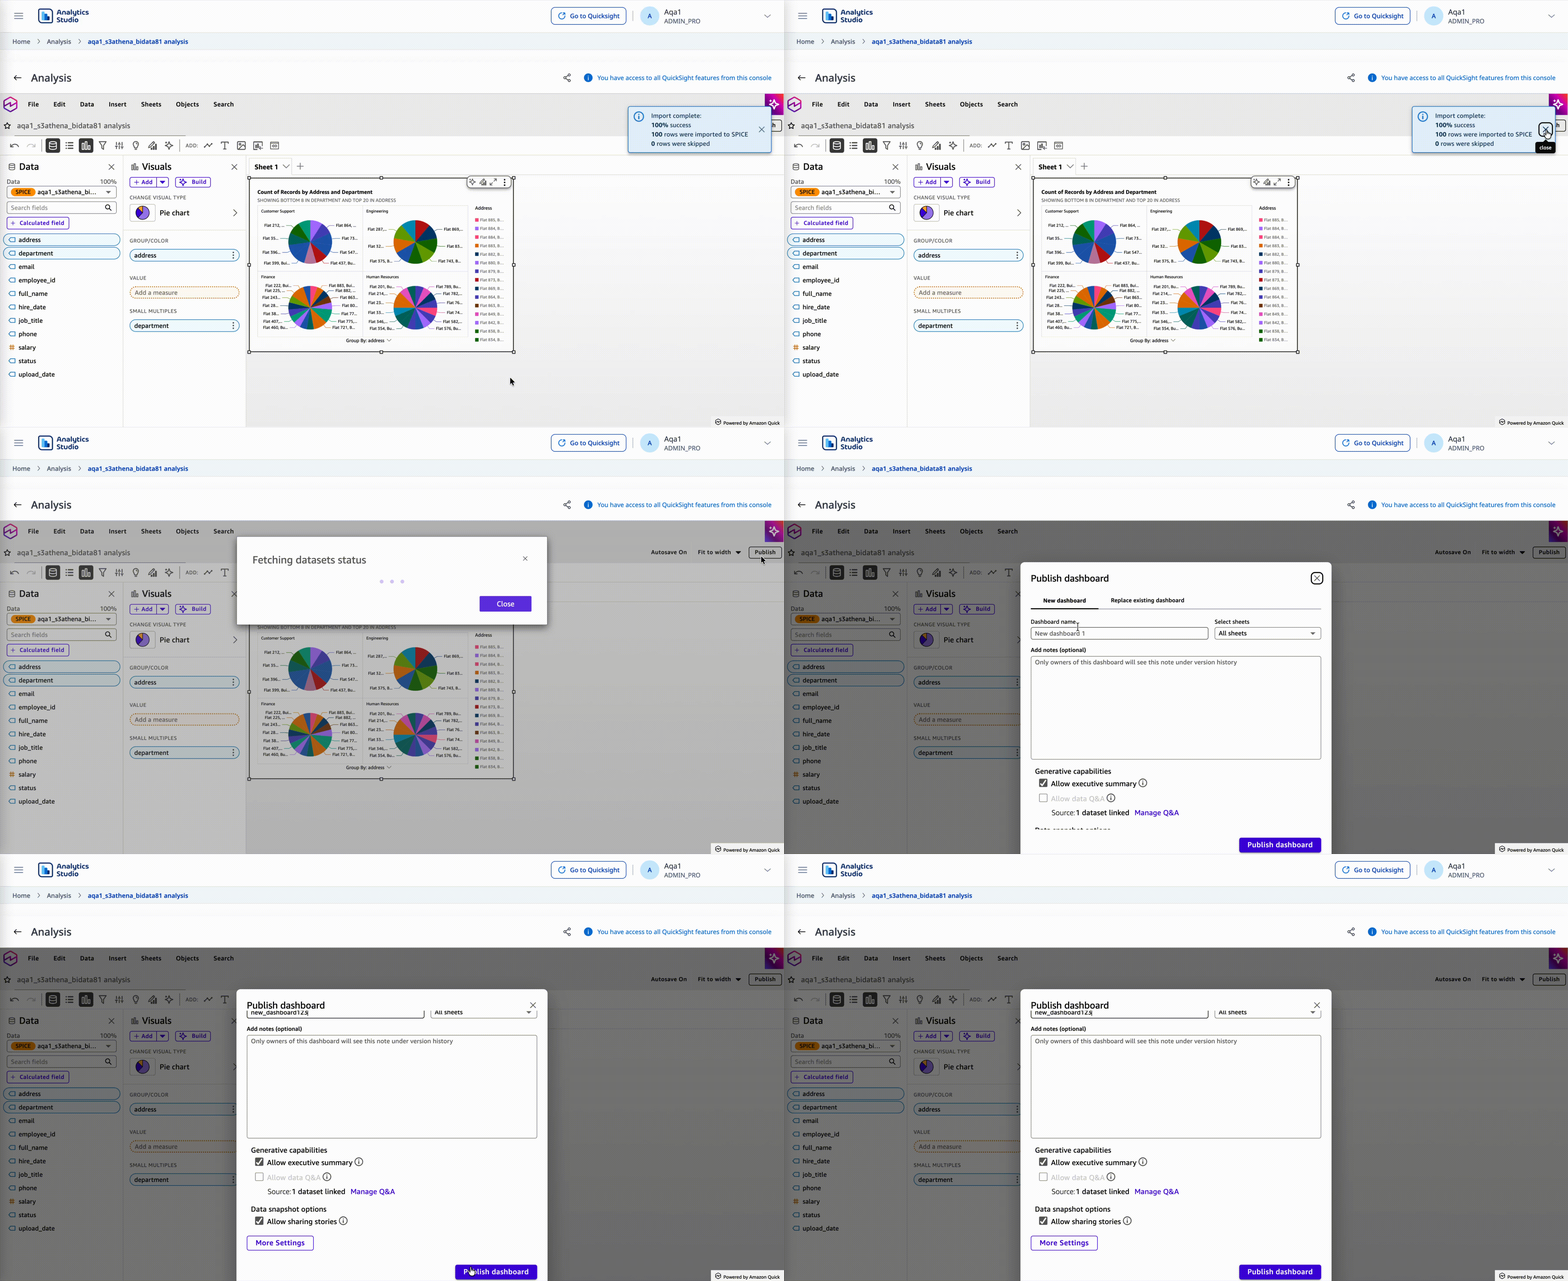
Creating a dashboard in the Studio is simple. You can create a dashboard by following the below steps:
- Open the analysis you wish to share.
- Click the
Publishbutton in the top navigation bar. - Provide a name for the dashboard and an optional description.
- Click
Publishagain to create the read-only view. Users can access dashboards from the "Dashboards" page.
Dashboards are designed as static snapshots of your data and cannot be directly updated or edited. To reflect changes made to the underlying analysis, you must publish it or create a new dashboard.
Delete a Dashboard
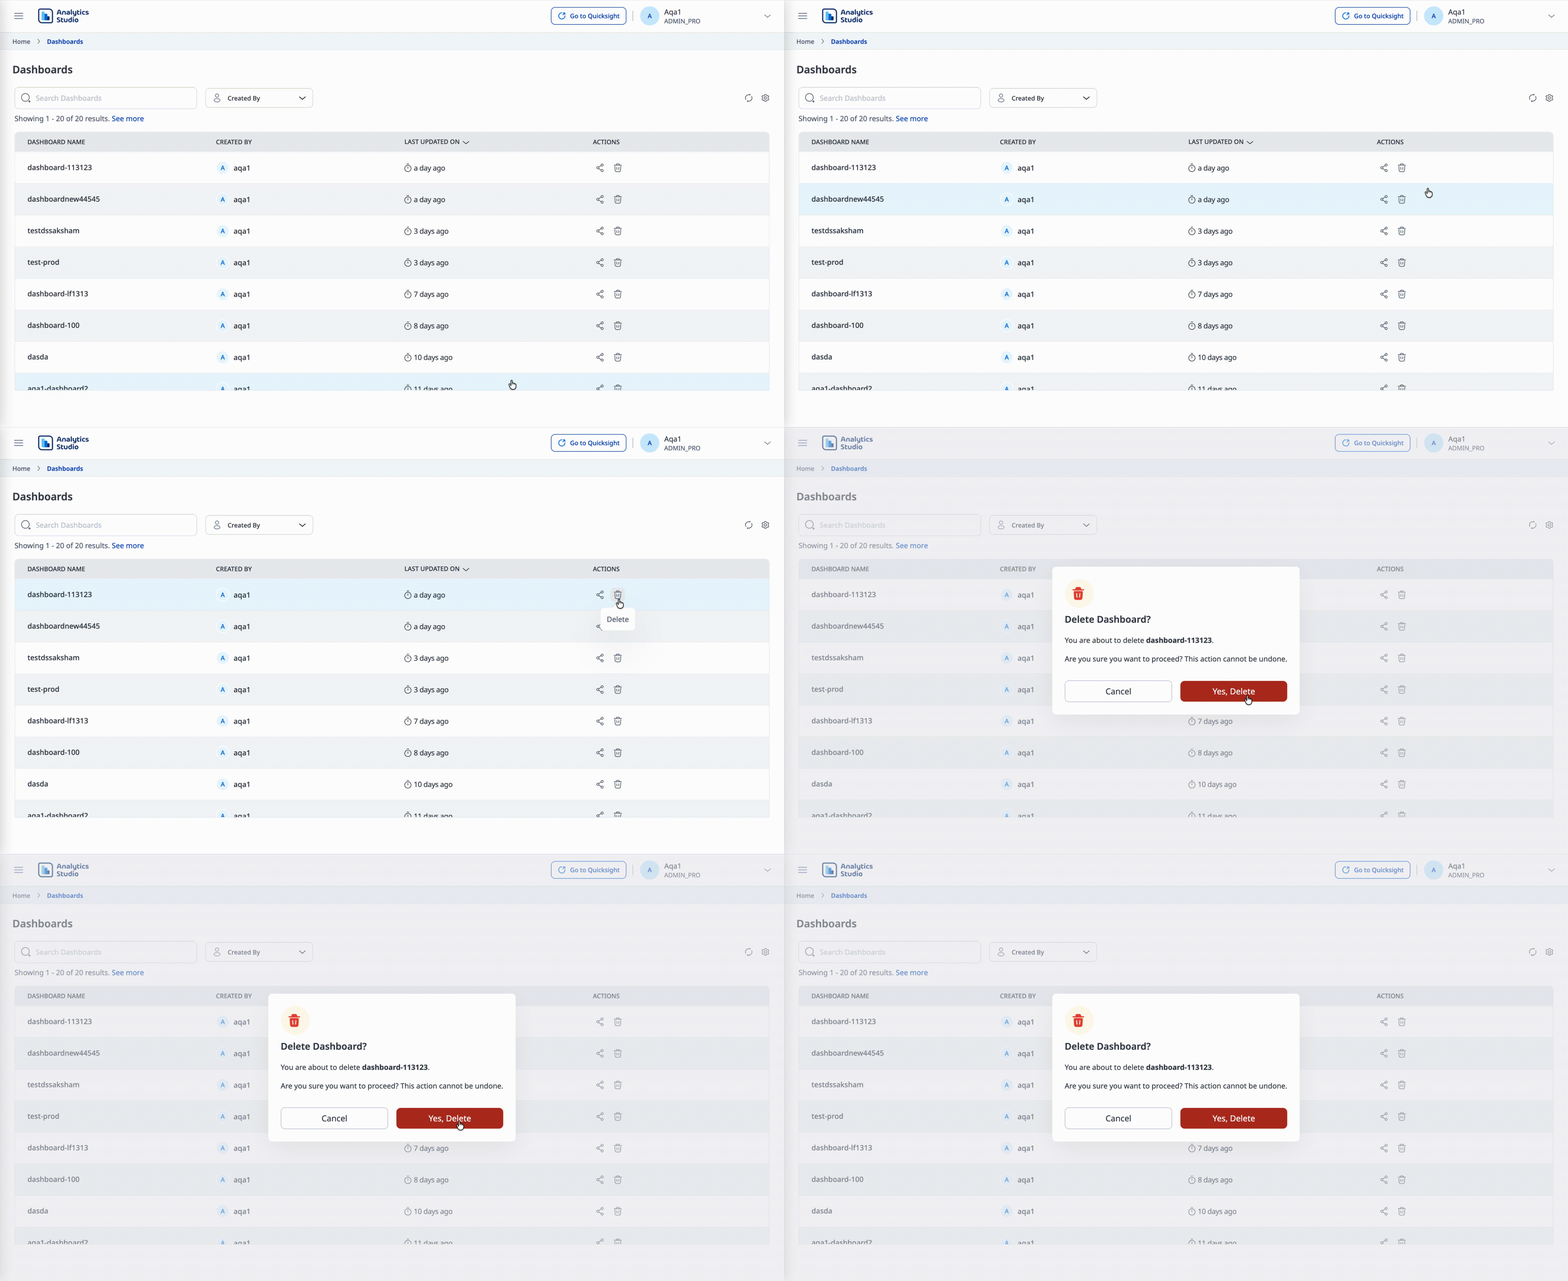
To remove a published view, click the 'Delete' () icon next to the dashboard in your assets list.
Sync Dashboards Deprecated
Registered users can synchronize their Analytics Studio Dashboards, along with any dashboards they have been granted access to within QuickSight, by selecting the Sync Dashboards button in the Analytics Studio app Center in Amorphic.
Dashboards synchronization is an asynchronous process. Once the synchronization is complete, the user will receive a notification via email.
Legacy Feature: Previously, registered users were required to interact with the Sync Dashboards button to import their QuickSight dashboards or those shared with them into the application. This was because the application lacked a native interface, and users had to manually sync their assets using this feature. While the button remains visible for backward compatibility, it is now deprecated as the native UI handles asset visibility automatically.
Topics
Topics serve as the intelligent interface for natural language discovery, empowering users to extract insights by asking plain-English questions about their data. By utilizing machine learning to map your datasets to common business terms, topics remove the technical barrier of traditional query languages, allowing stakeholders to gain immediate answers through a conversational interface.
Topics are a premium feature and are only available to users with Pro roles and Amazon Q enabled for their environments.
Create a Topic
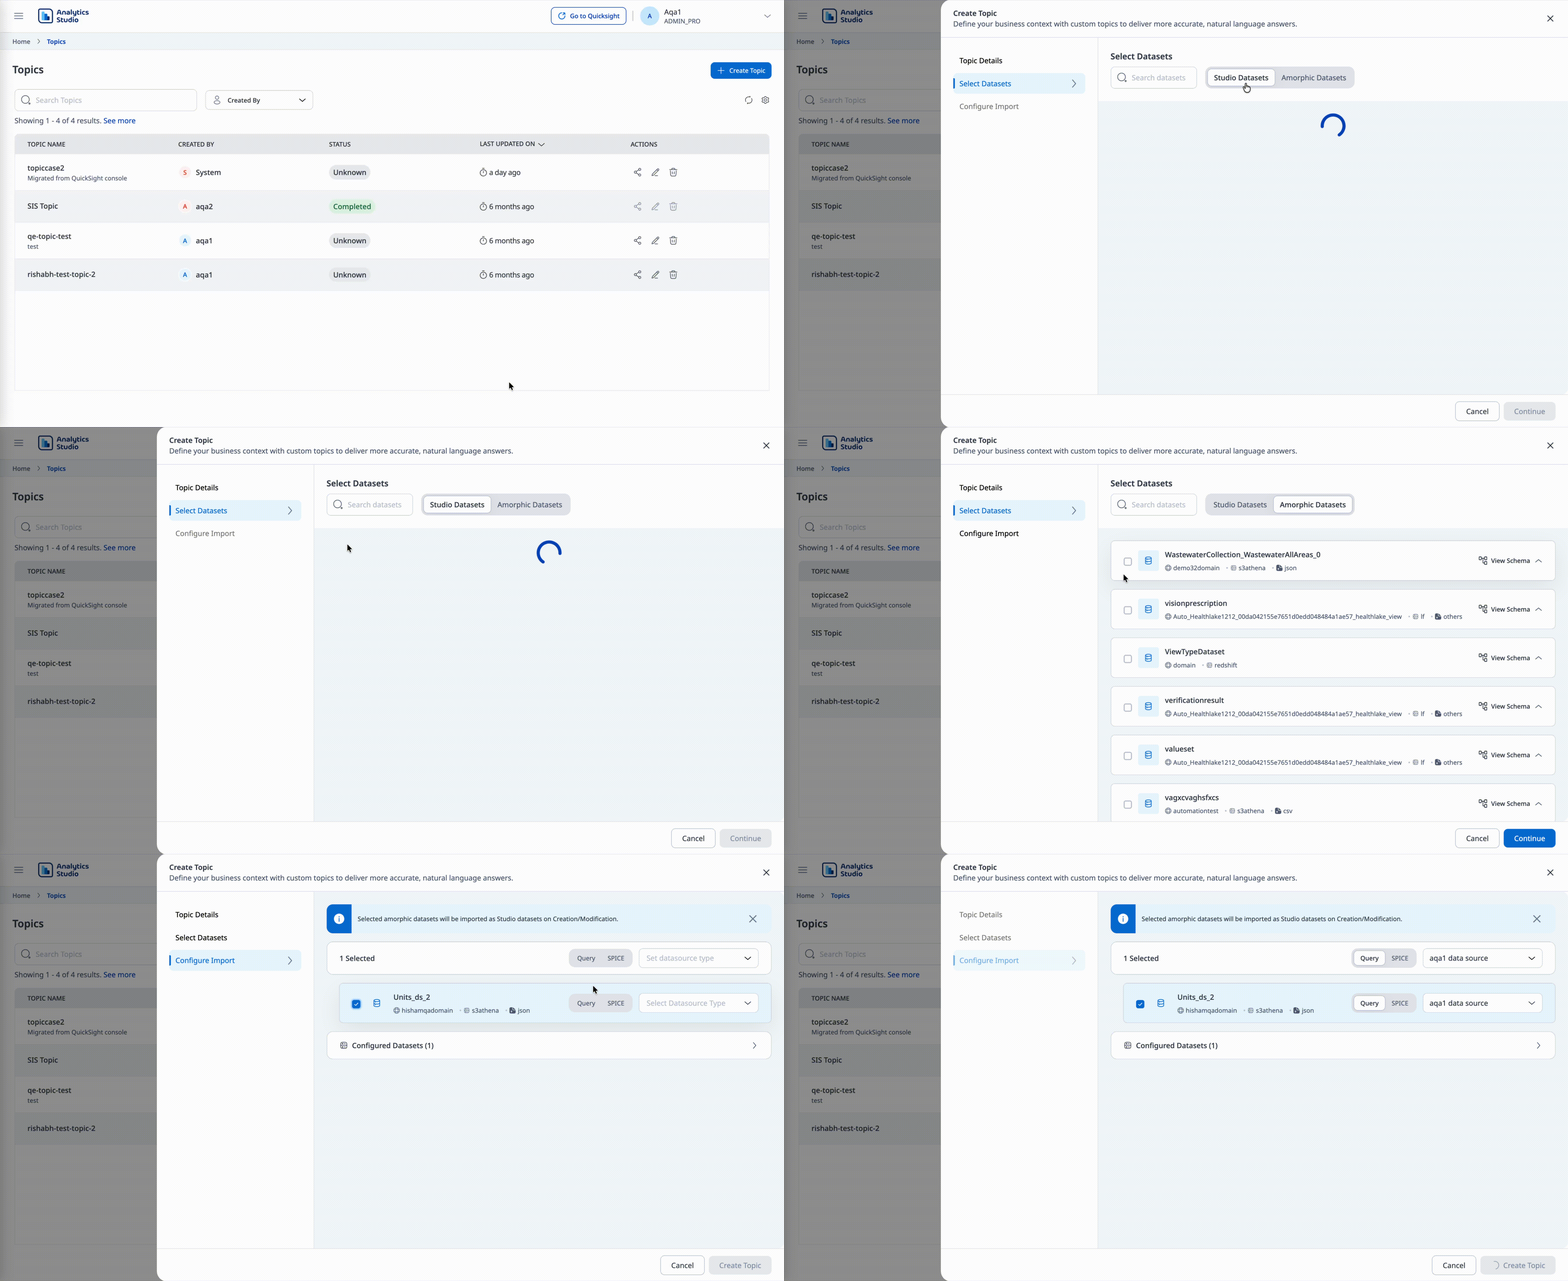
To enable natural language queries for your datasets, follow these steps to create a new topic:
- From the Homepage or the Topics page, click the
Create Topicbutton. - Enter a name and an optional description to help the AI understand the context of the data.
- Select datasets that will serve as the knowledge base for this topic. You can choose:
- Amorphic datasets, or
- Analytics Studio datasets that already exist in the application.
- If you select an Amorphic dataset, choose a datasource for it:
- Lake Formation and S3 Athena datasets support only the default Athena datasource.
- Redshift datasets allow you to select from already created Redshift datasources.
- Click
Create Topicagain to create the topic.
Users can only access topics that are in a "Completed" or "Unknown" state.
If a topic is created using Amorphic datasets that do not yet have an equivalent QuickSight representation and some of them have "SPICE" configuration, the system will initiate a background data ingestion process. During this period, the topic status will be marked "In progress". If this occurs:
- Monitor Ingestion: Track the data ingestion progress in the Anlystics studio datasets section for the newly selected "SPICE" configured datasets until completion.
While it is possible to navigate to the Quick console to manually refresh a topic in this case, we strongly discourage this. It is often confused with the "Retry" button, which recreates the topic outside of Analytics Studio's scope. Clicking the "Retry" button will BREAK the synchronization between QuickSight and Analytics Studio, rendering the topic orphaned and undeleteable.
Update a Topic
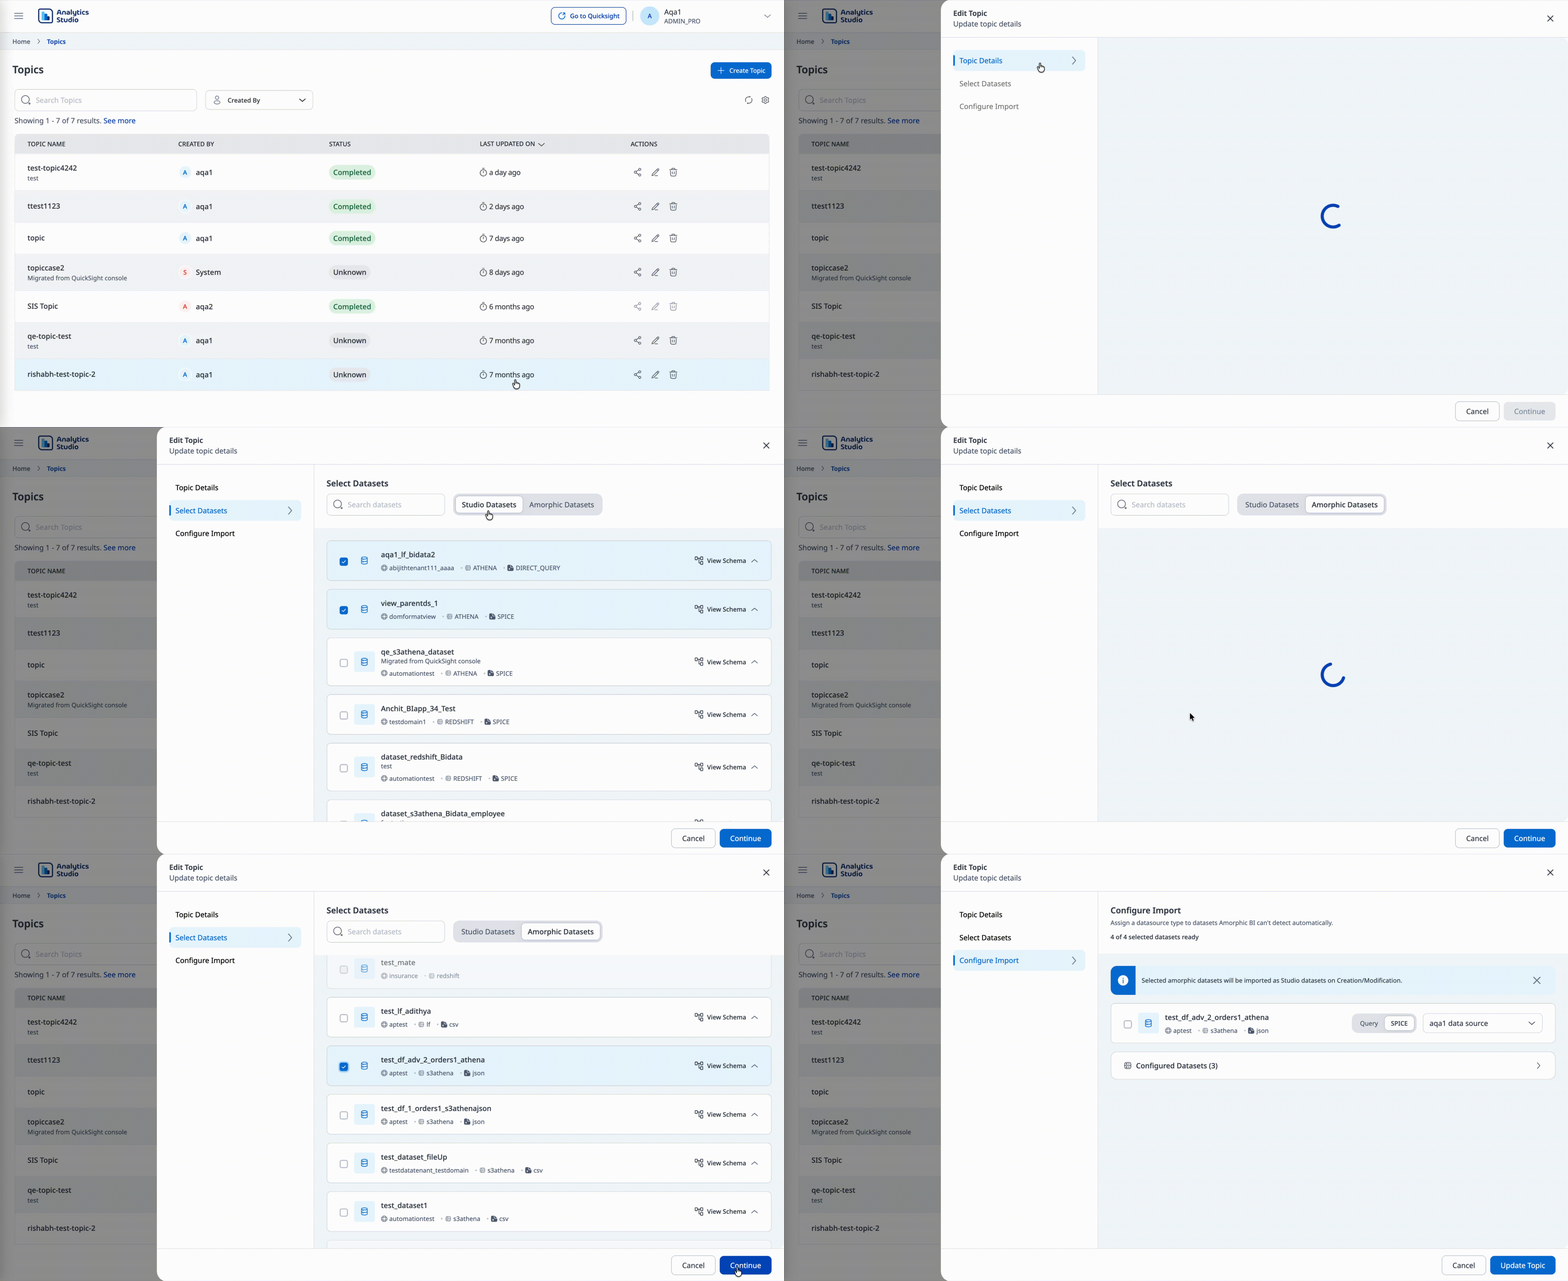
You can refine a topic by clicking the 'Edit' () icon and selecting more datasets to expand the scope of questions the AI can answer. Dataset selection during update follows the same rules as creation:
- Choose Amorphic datasets and/or already created Analytics Studio datasets.
- For each selected Amorphic dataset, choose a datasource:
- Lake Formation and S3 Athena datasets support only the default Athena datasource.
- Redshift datasets allow you to select from already created Redshift datasources.
After successfully updating, go to the topic in the Quick console and refresh it to update the topic with the new data.
Before refreshing the topic from the Quick console, ensure that the ingestion process for all newly added datasets is completed.
Delete a Topic
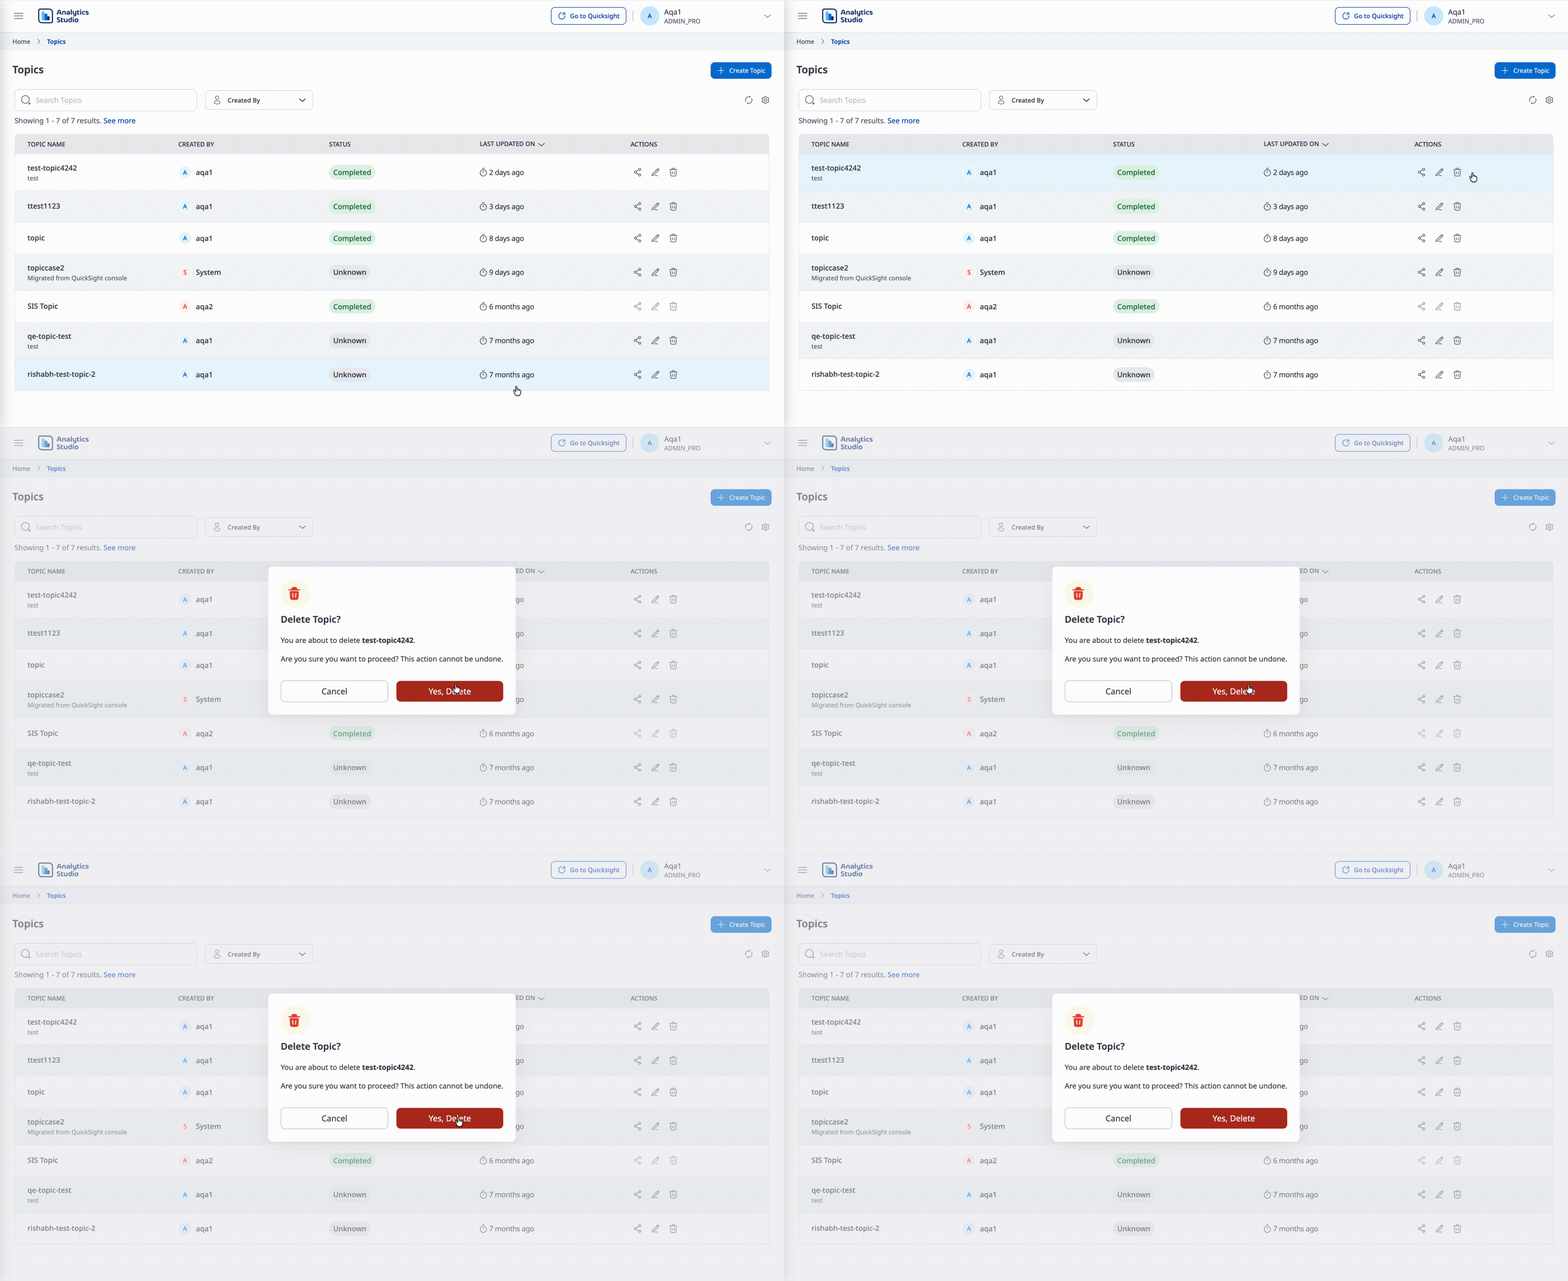
To remove a topic, click the Delete () icon next to the topic to remove it from your workspace.
Asset Sharing
Asset sharing facilitates seamless collaboration by allowing you to distribute access to your created assets among authorized team members. By managing permissions at the individual user level, you can ensure that stakeholders have the appropriate visibility—whether they need to simply view insights or co-author the underlying logic—thereby fostering a shared, data-driven decision-making environment across the organization.
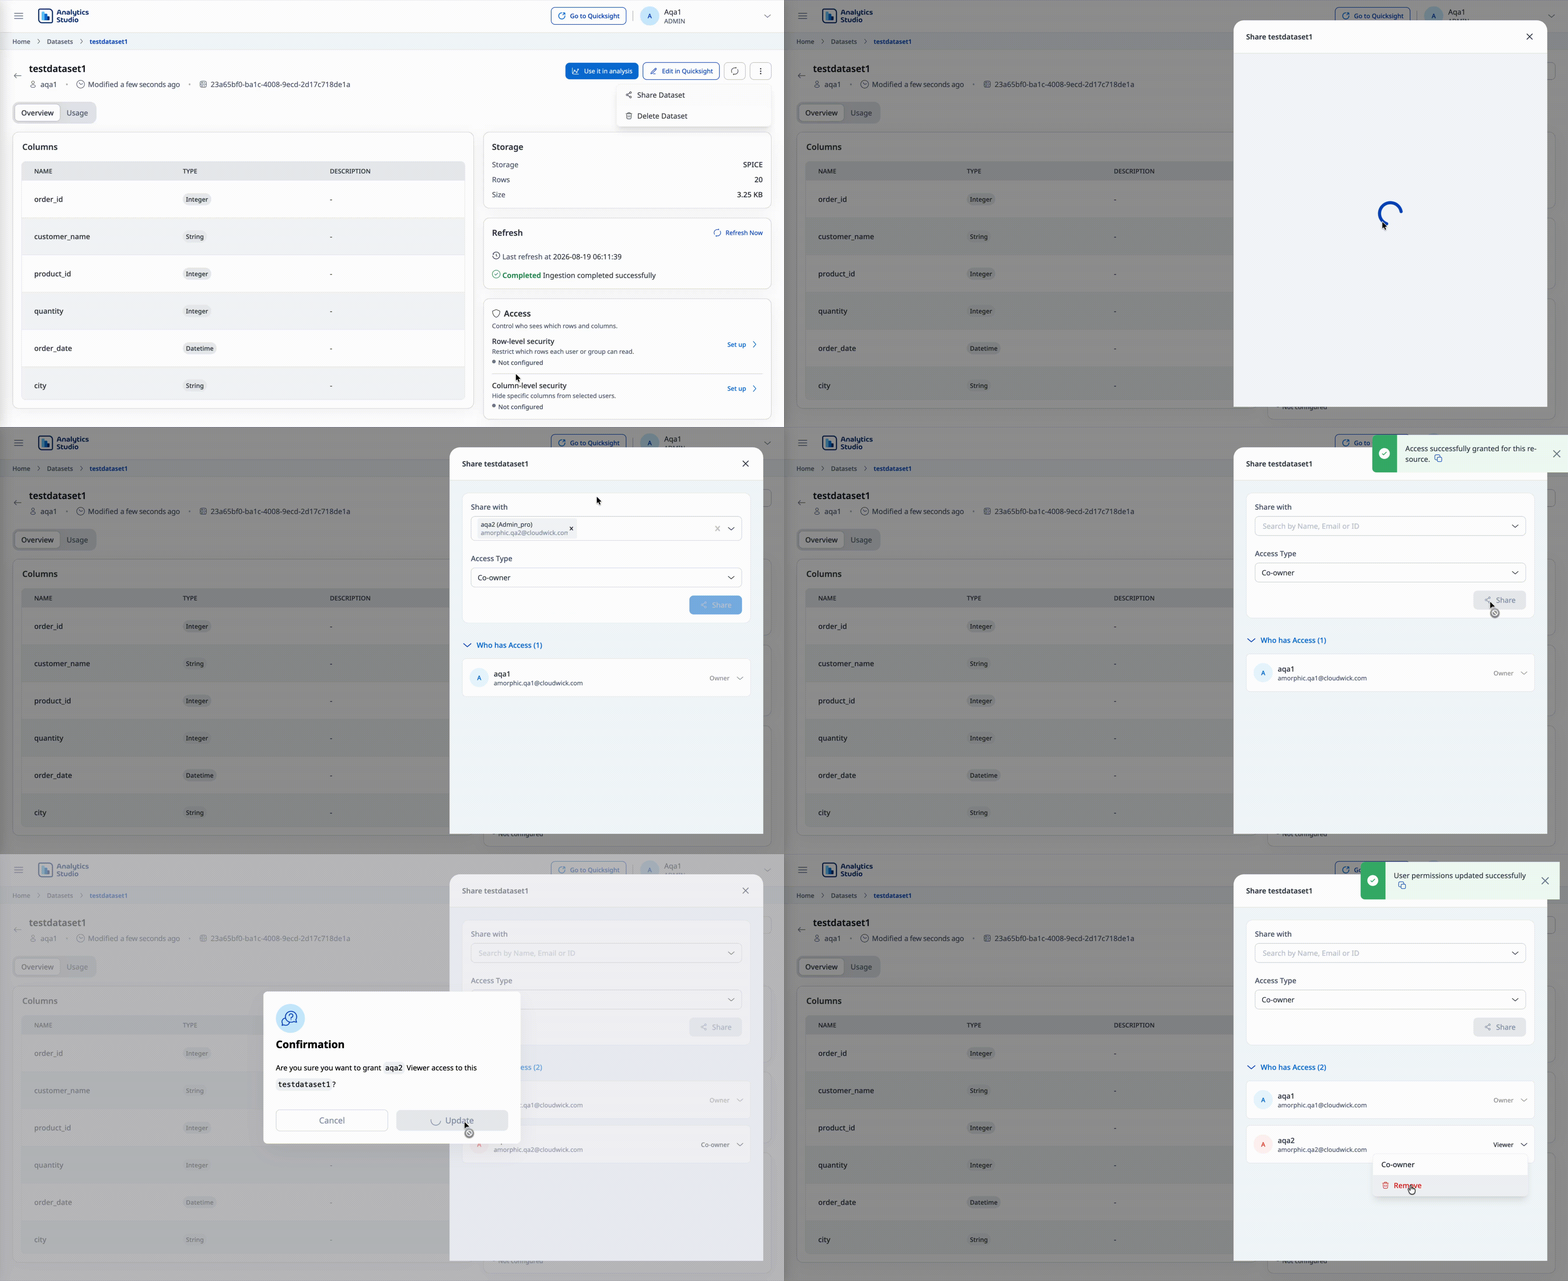
You can collaborate with other users by sharing access. Follow the below steps to share access of an asset:
- Click the 'Share' () button on the asset you wish to distribute.
- Select a user from the authorized list.
- Grant an Access-Level (e.g., Viewer or Co-owner) to define their permissions.
- Click on the
Sharebutton to finalize the changes.
Permissions and access levels vary depending on the asset type and user role:
- Analyses: Can only be shared with Admins and Authors. Readers cannot access analyses as these are active development spaces. Co-owners can edit, view, and share the analysis.
- Dashboards: Can be shared with all roles (Admins, Authors, and Readers). Co-owners can share the dashboard and save it as a new analysis, while Viewers can export data.
- Topics: Can be shared with all roles. Co-owners can edit and share the topic, while Viewers can use it to ask natural language questions.
- Datasources: Can only be shared with Admins and Authors. Co-owners can edit, share, and delete the datasource, while Viewers can use it to create or connect datasets.
- Datasets: Can only be shared with Admins and Authors. Co-owners can edit, refresh, share, and delete the dataset, while Viewers can use it in analyses, dashboards, and topics.
- Reader Restrictions: Users with the Reader role can only be granted Viewer access. The Co-owner option is restricted to Admin and Author roles.
Human-readable URLs
Analytics Studio generated human-readable URLs for Analyses, Dashboards, and Topics to facilitate sharing of links that are easier to recognize than opaque asset IDs. The readable segment of the URL combines a name-based slug from the asset with a short stable ID unique to that asset.
While opening an asset, the browser address updates from the technical ID to a readable path derived from the asset name. For example, .../dashboards/550e8400-e29b-41d4-a716-446655440000 changes to .../dashboards/QuarterlySales-5440000.
Sharing Tips
- Open the asset to be distributed.
- Copy the URL from the browser address bar.
- Send the link to users who already have access (or share the asset with them first using the share action above).
- A human-readable URL does not grant access by itself. Recipients still need the appropriate permission on the asset (Viewer or Co-owner).
- Older URLs with full asset IDs will continue to work, but will redirect to the new address style.
If an asset is renamed, its readable URL updates to match the new name. Prefer re-copying the link after a rename so recipients use the latest URL. The underlying asset ID remains unchanged.