Overview
Dashboards provide a personalized and powerful way to access key features, monitor data, and track activities related to your tasks, datasets, and other resources within the application. They offer a centralized view, allowing you to quickly understand the state of your data and infrastructure. When you first log in, you'll be greeted by your default dashboard. This dashboard is pre-configured to provide a general overview of your data and resources.
Starting with Amorphic 3.0, Insights are no longer a standalone module. As part of the upgrade from 2.7 to 3.0, Insights were merged into Dashboards. Use the Insights Details widget on a dashboard to monitor Jobs, Dataset Metrics, Data Pipelines, and Dataflow runs.
No action is required from users. During the upgrade, existing Insights are automatically moved into Dashboards.
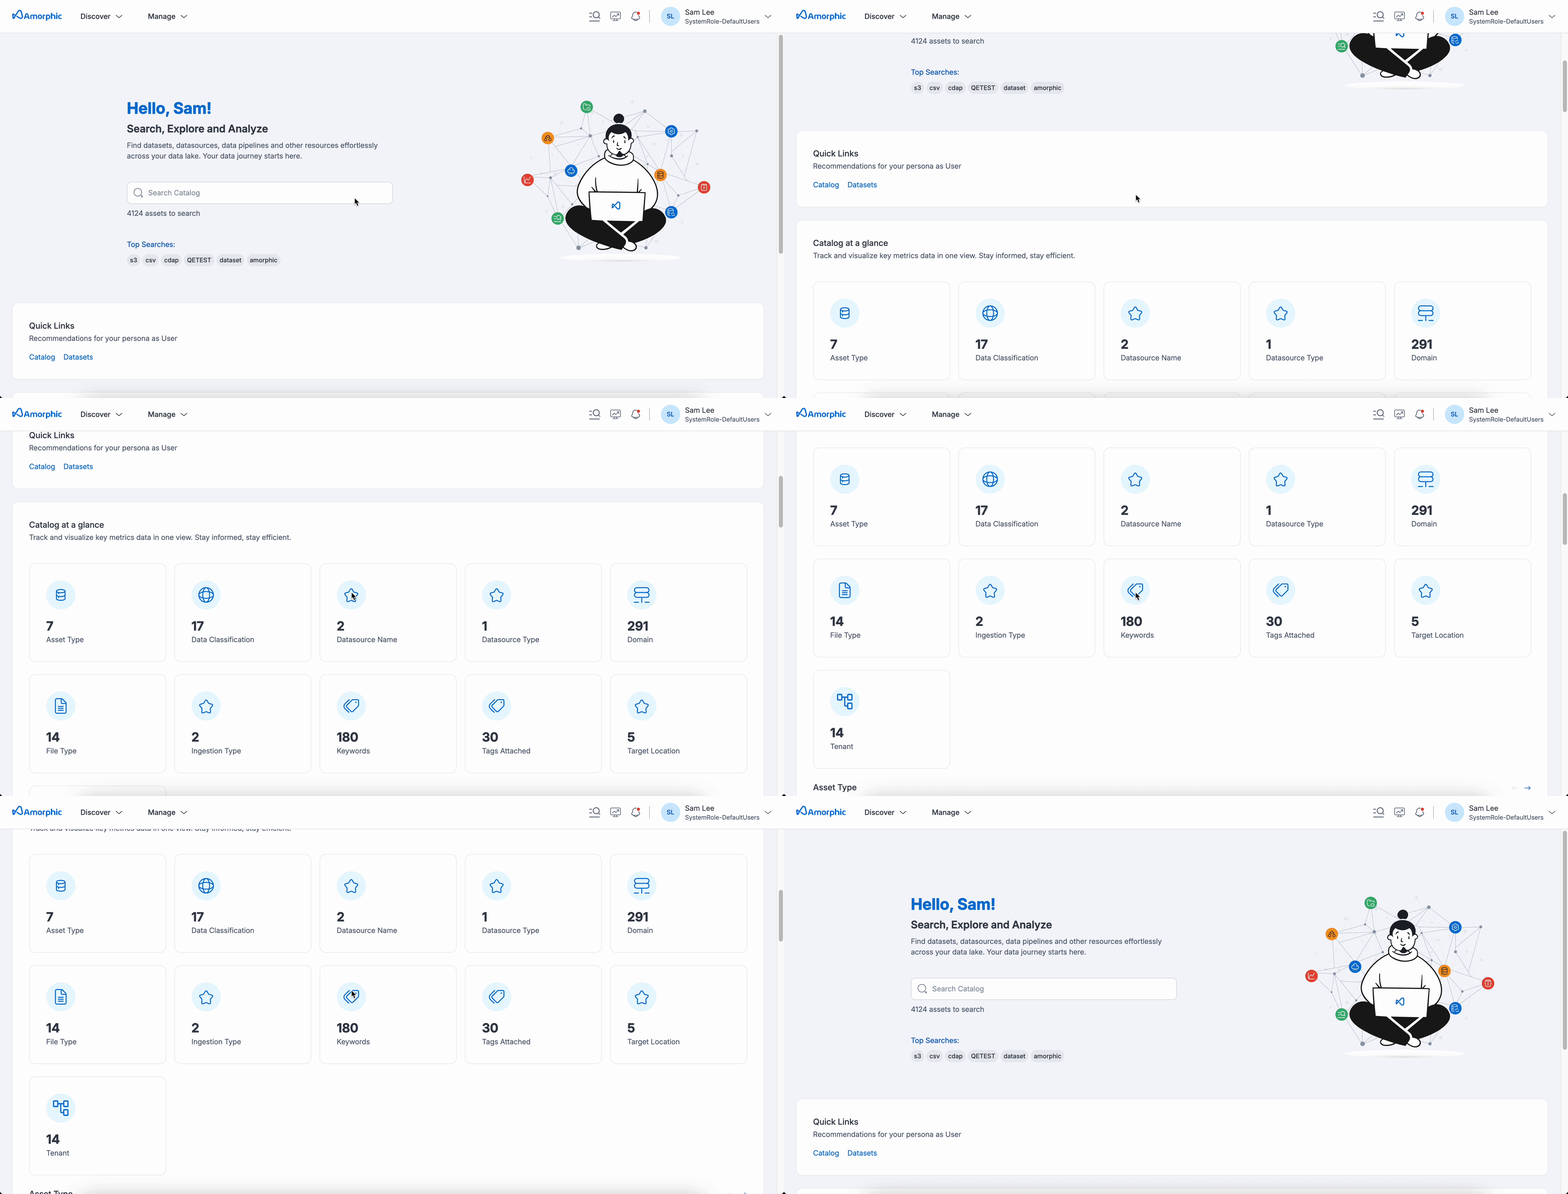
For regular users, the dashboard displays the following charts:
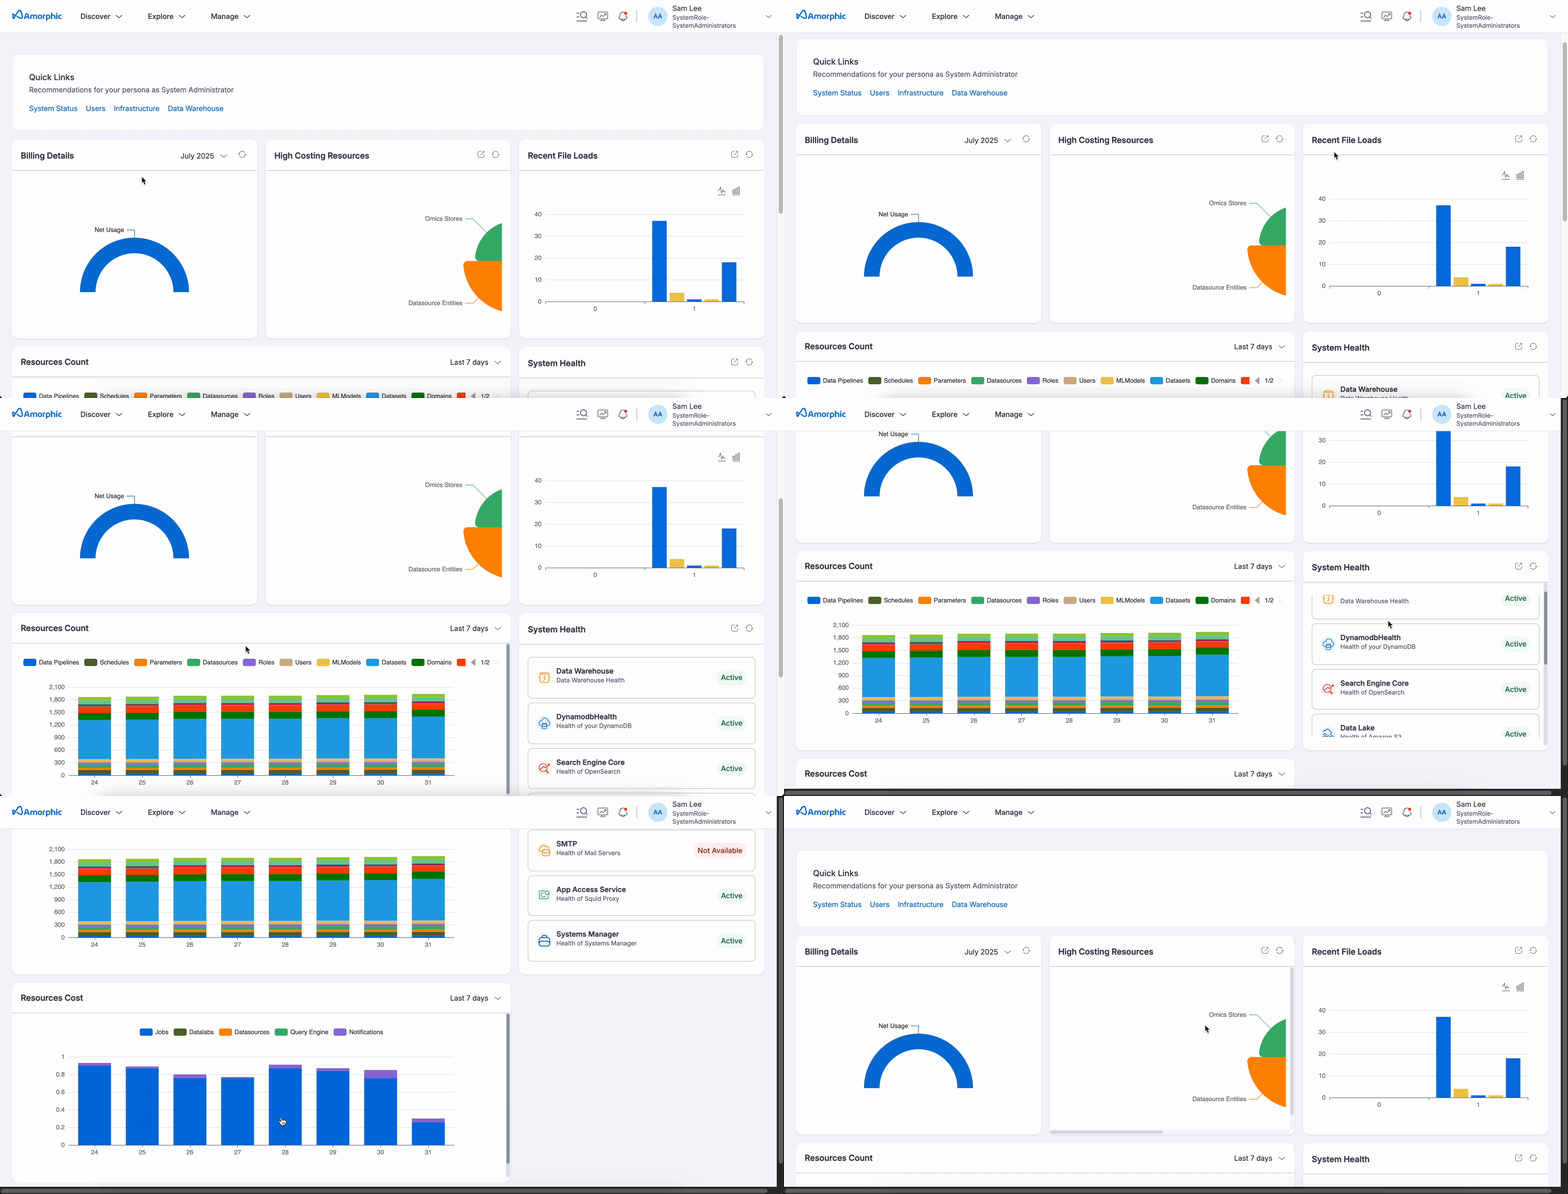
For admin users, the dashboard displays the following charts:
Users can create custom dashboards as per their preference and switch between them.
How to create a custom dashboard?
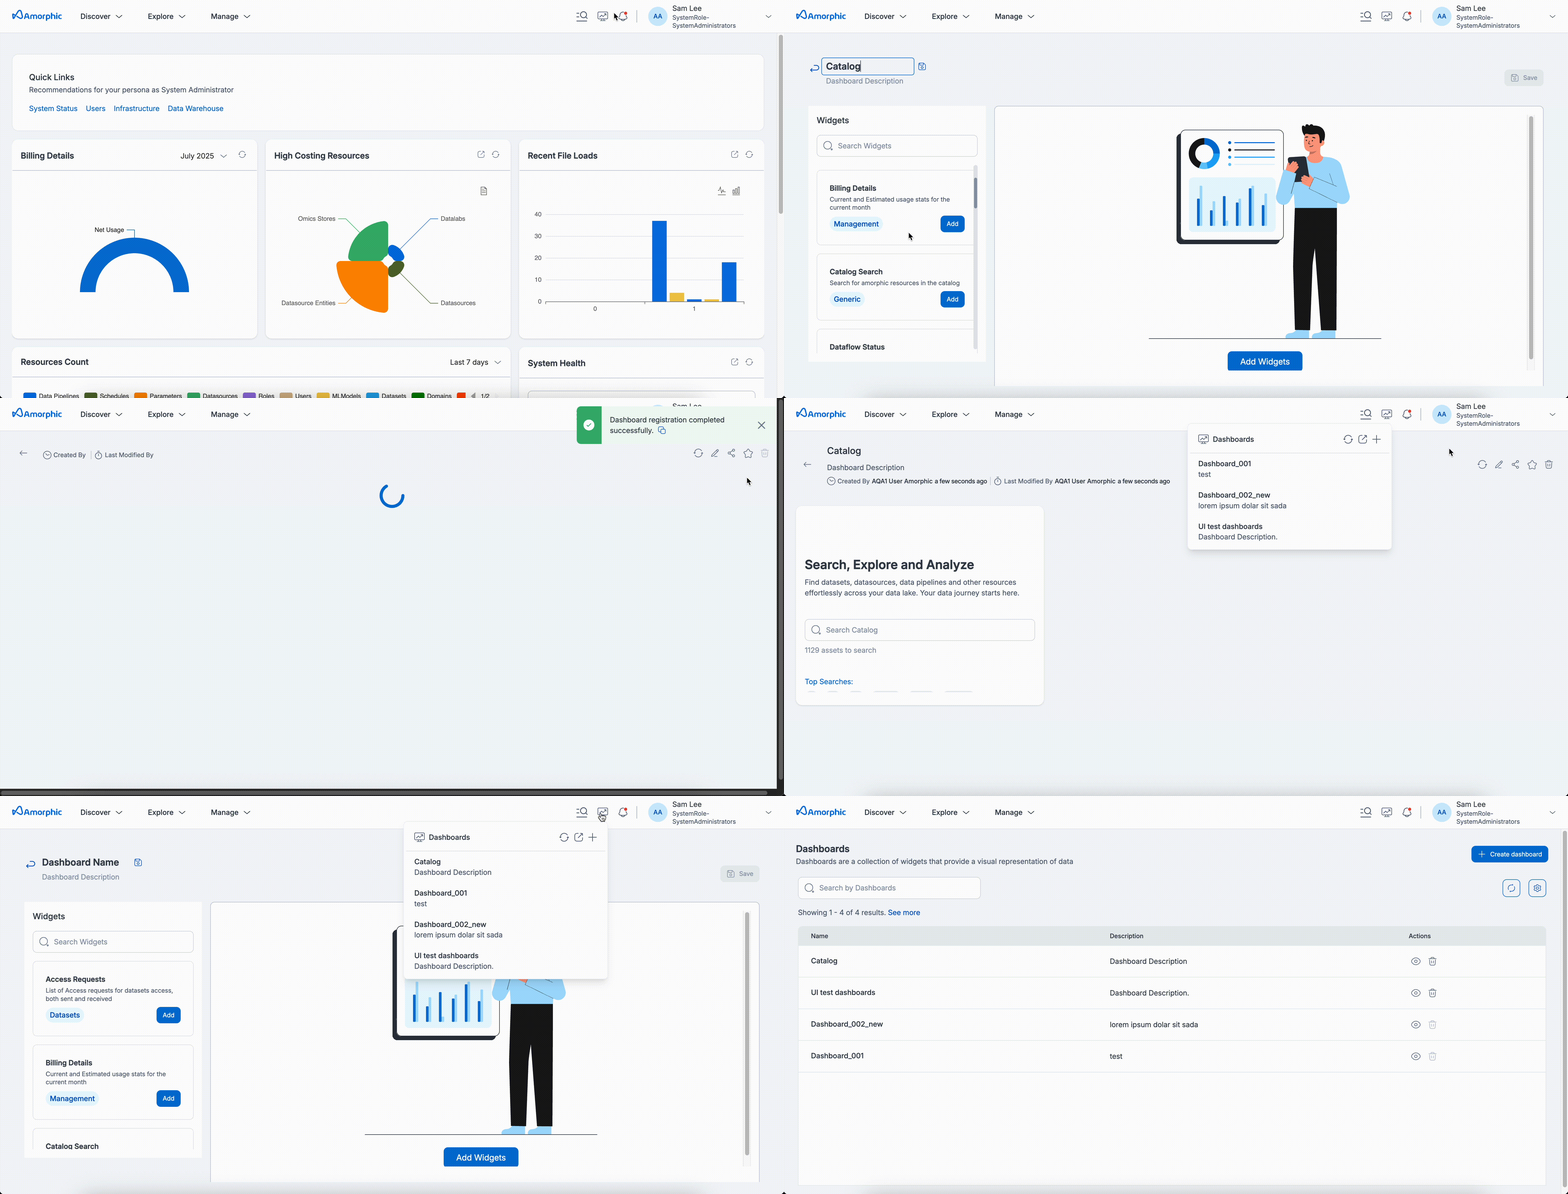
To organize related information and conveniently access it, you can construct multiple dashboards and toggle between them on the home page. To create a dashboard, follow the outlined steps and the accompanying GIF:
- Locate the Dashboards icon located at the top right corner of your screen.
- Select the
Create New Dashboard(plus icon) option. - Provide a descriptive name for your dashboard.
- Browse the available widgets from the provided list and select the ones that best suit your needs.
- Customize the selected widgets by modifying their attributes as required.
- Once all the desired widgets have been added, click the “Save” button to finalize the dashboard creation.
Widgets
A dashboard is built up using widgets. Each widget will show you the relevant information in a graph or other visual formats. By using widgets, you can easily track the following features:
| Attribute | Description |
|---|---|
| Access Requests | List of Access requests for datasets access, both sent and received |
| Billing Details | Current and Estimated usage stats for the current month |
| Catalog Search | Search for amorphic resources in the catalog |
| Dataset Lineage | To track the dataset journey |
| FlexiQuery | Quick query to run on your data |
| High Costing Resources | List of all High costing resources in the application |
| Quick Links | Any links within and/or outside the application |
| Quick Sight Dashboard | Render a QuickSight dashboard you have access to |
| Recent File Loads | Recent and current file load executions count |
| Resources Cost | To check the cost of resources per day |
| Resources Count | Check the count of resources per server over time |
| System Health | Track system health status for each service |
| Insights Details | Track the status of various resources within the Amorphic platform |
Insights widget provides a brief overview of recent execution history and the associated status for the following supported resources:
- Jobs
- Dataset Metrics
- Data Pipelines
- Dataflow Runs for a JDBC Bulkload Datasource
- Dataflow Runs for a JDBC Advanced Data Load Datasource
- Dataflow Runs for an ArcGIS Datasource
Limitations:
- Maximum of 10 execution records shown per resource
- For Full-Load-CDC and CDC type of Bulkload, Advanced Data Load, and ArcGIS dataflow runs, only the most recent execution status is displayed
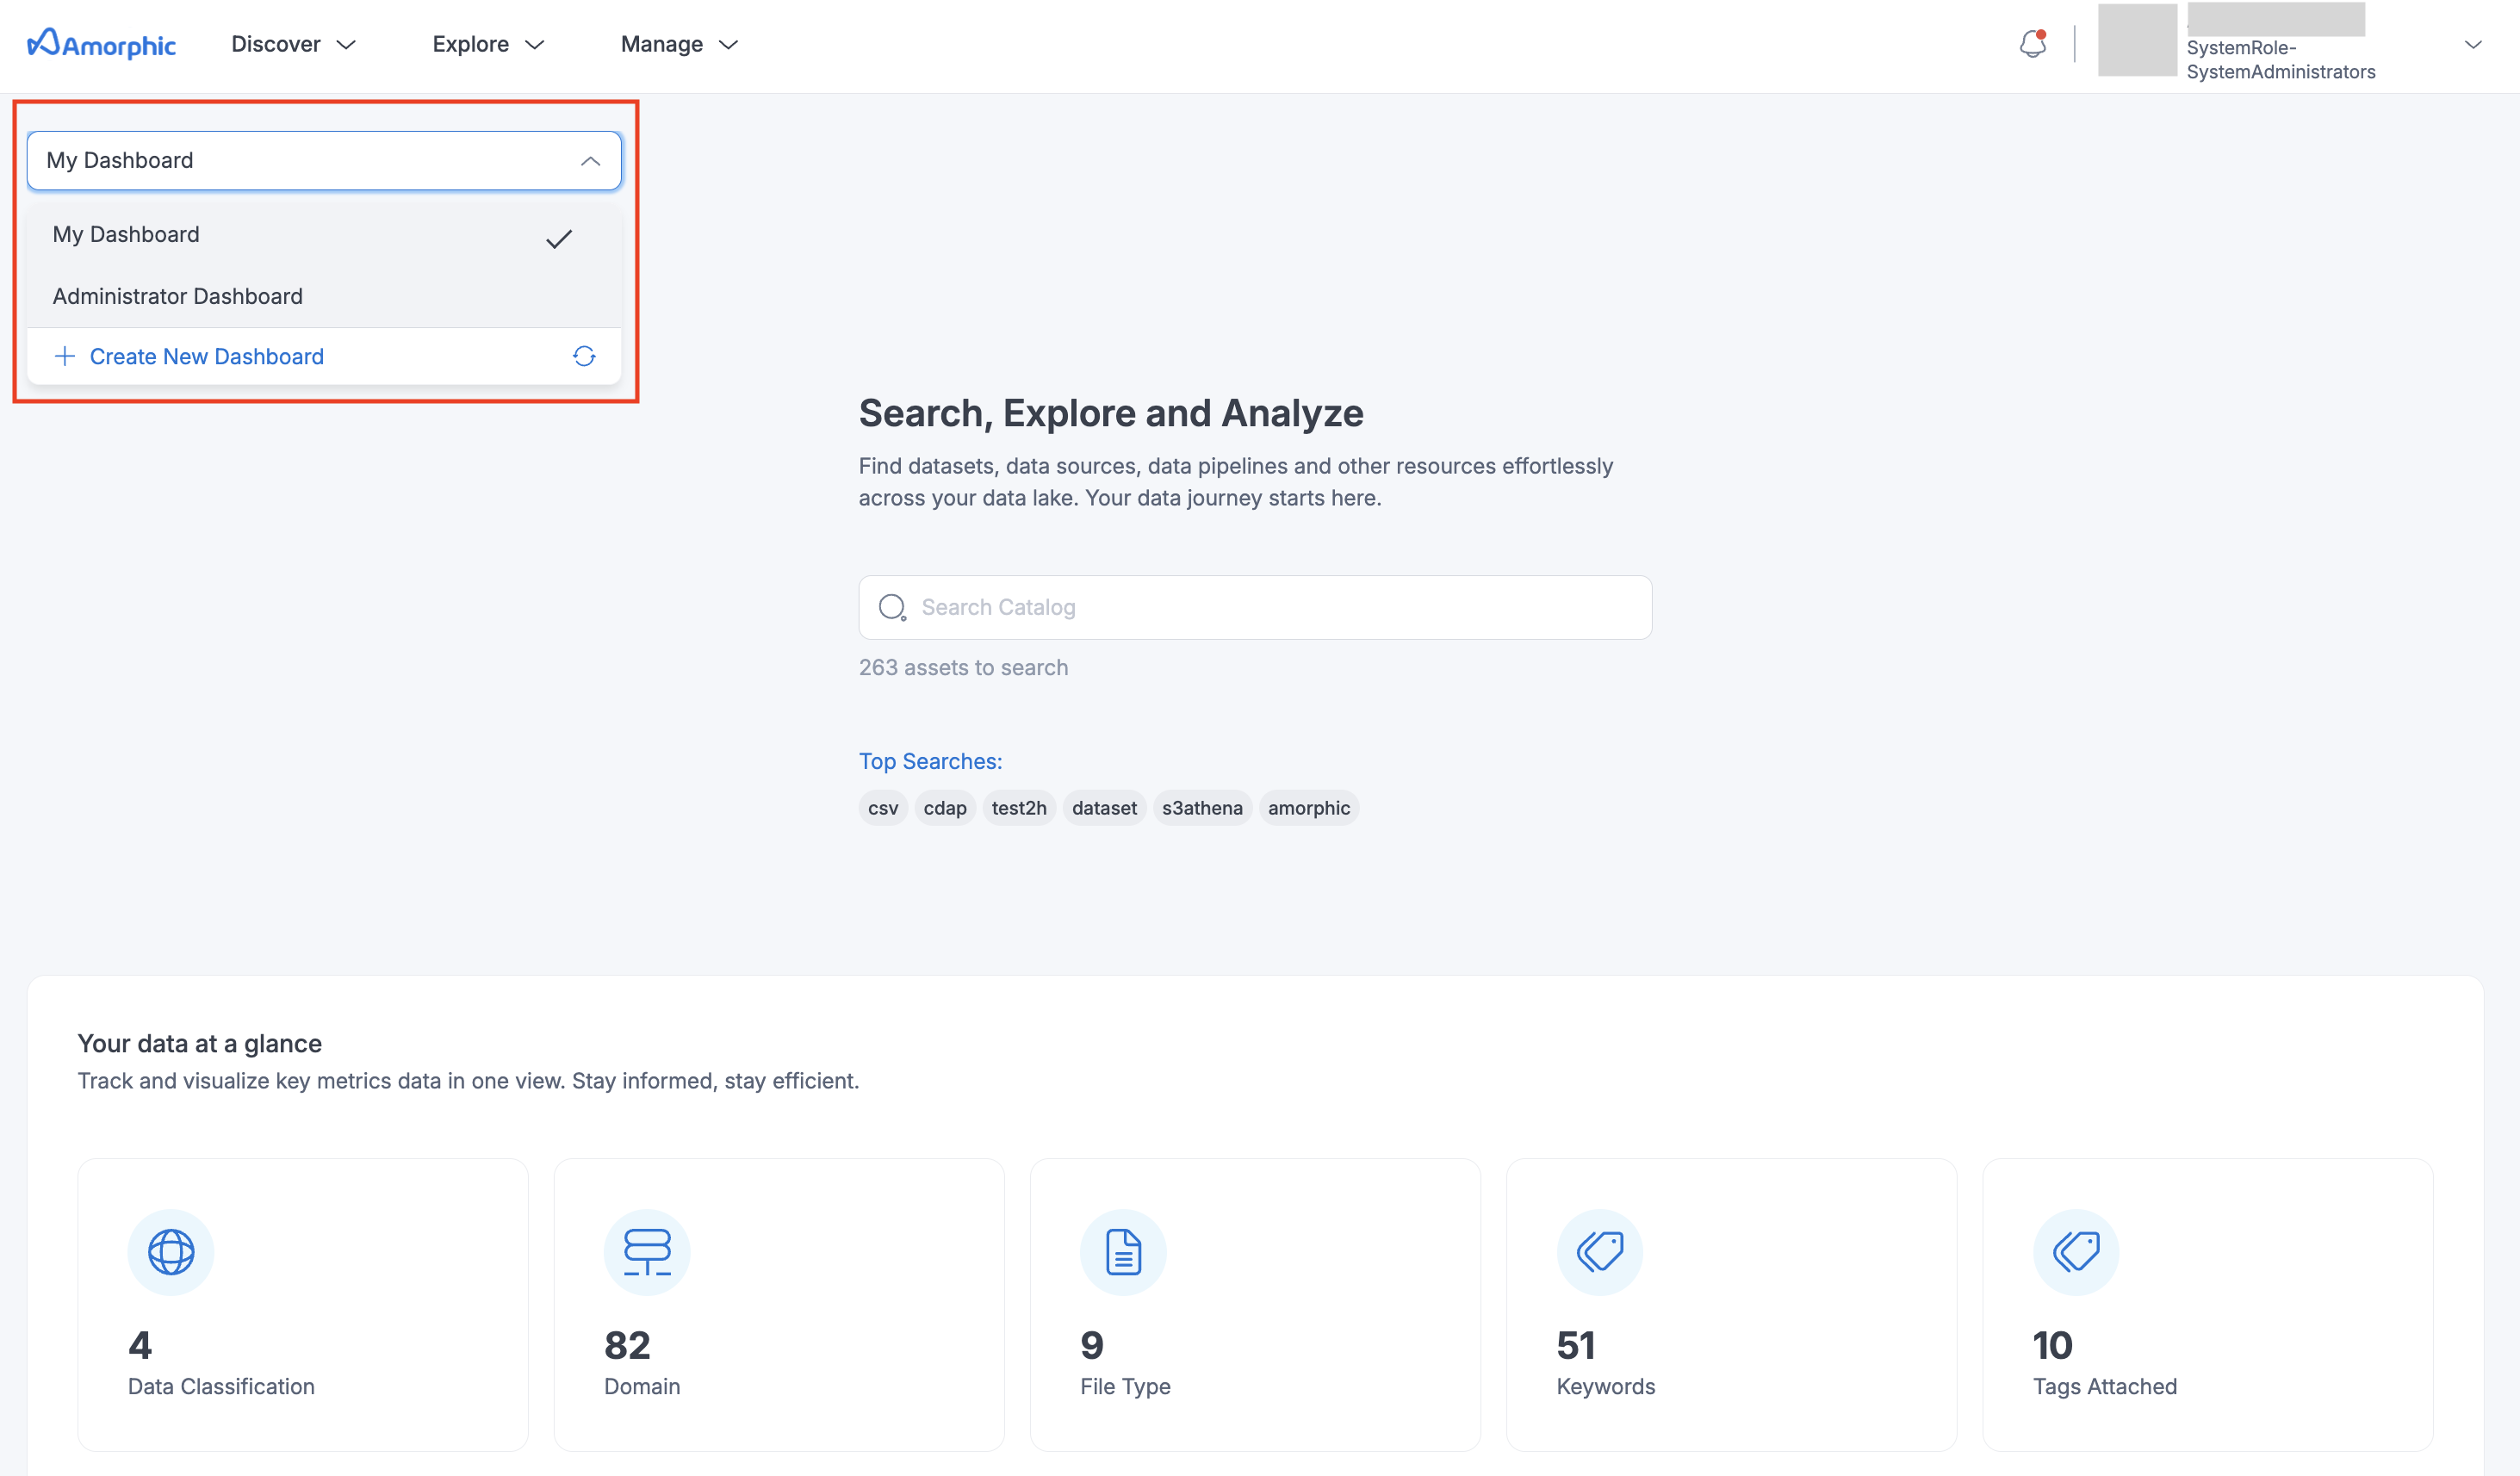
To select a different dashboard, you can use the drop-down list as shown in the image below.
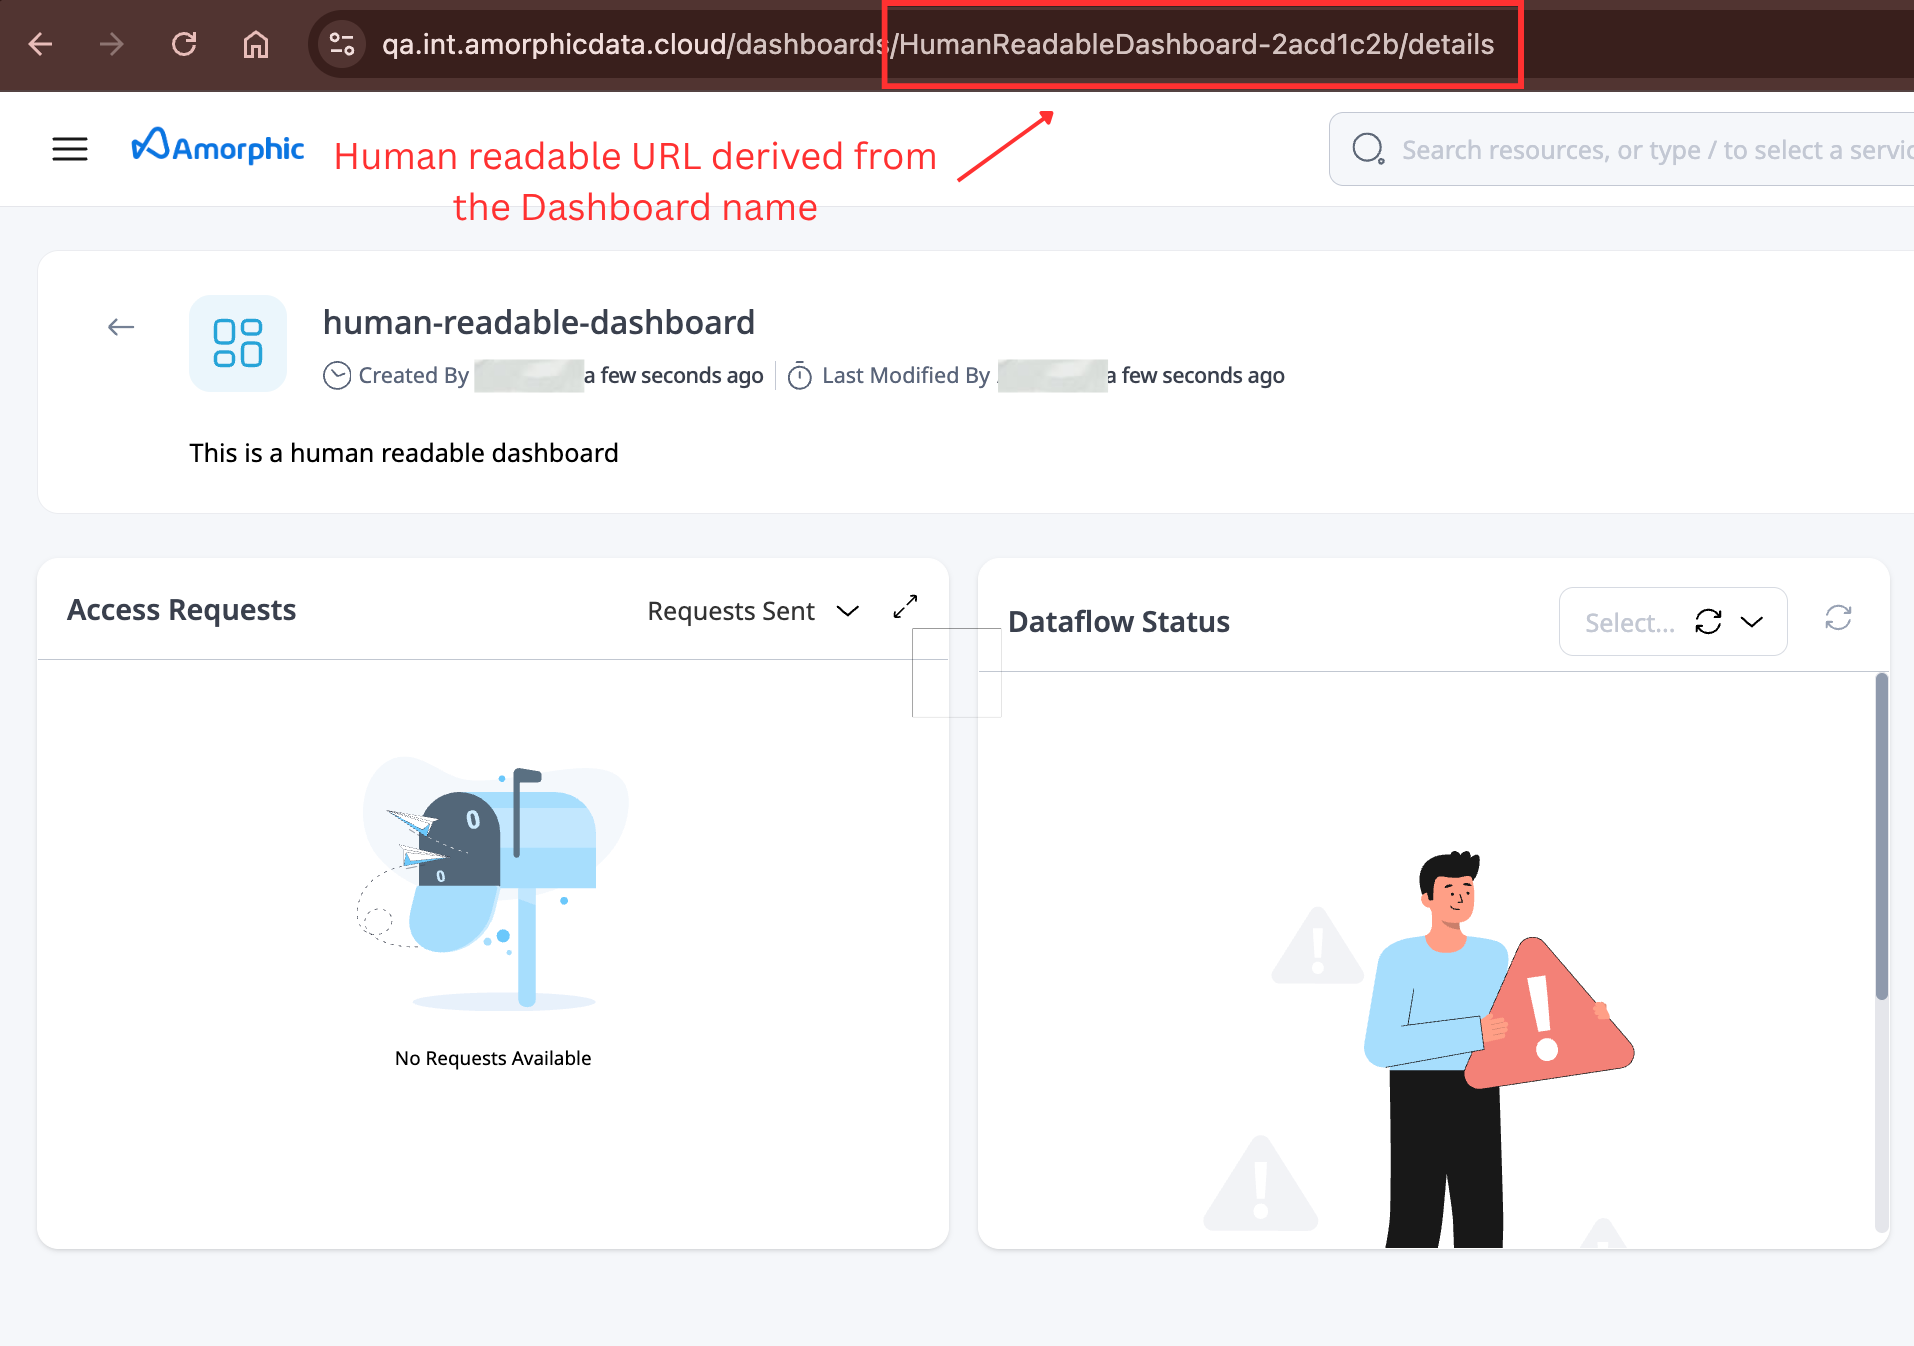
Human readable URLs
Custom dashboard URLs include the dashboard name so you can tell which dashboard you are viewing without relying on a UUID.
When you open a dashboard, the browser address looks like:
/dashboards/SalesOverview-<unique-id>/details
- The first part comes from the dashboard name (spaces and special characters are removed).
- The last part is a short unique identifier so dashboards with similar names stay distinct.
You can bookmark or share this URL to return to the same dashboard. Creating, viewing, updating, and deleting a dashboard continue to work from the human-readable URL.
- If you rename a dashboard, the readable part of the URL updates to match the new name. Use the updated URL after a rename.
- New dashboards get a human-readable URL when they are created. Existing dashboards get one the next time they are saved.
Below image shows a dashboard human-readable URL in the browser.