
Cost Management (BETA)
Cost Management provides a centralized view of cloud spending across the connected AWS account and the Amorphic platform. By combining AWS billing data with Amorphic-specific cost insights, it helps organizations monitor spending trends, compare actual costs with forecasts, identify high-cost resources, and understand which AWS services contribute most to overall cloud spend.
Getting Started
Cost Terminology
The Cost Management dashboard categorizes costs into the following groups:
| Cost Type | Description |
|---|---|
| AWS Cost | Total cost incurred across all resources in the connected AWS account. |
| Amorphic Infrastructure Cost | Estimated Cost of Amorphic Infrastructure resources provisioned during the application deployment. |
| Amorphic Application Cost | Estimated Cost of the Amorphic resources provisioned during the application usage, such as Datalabs, DMS Instances, knowledge bases etc. |
| Amorphic Cost | Combined total of Estimated Amorphic Infrastructure Cost and Estimated Amorphic Application Cost. |
Amorphic cost metrics are calculated from AWS billing data for resources attributed to Amorphic and may not include certain AWS service usage charges (such as OpenSearch Search & OpenSearch indexing charges) that cannot be associated with Amorphic resources through cost allocation tags. Cost and forecast values may take time to reflect the most recent usage.
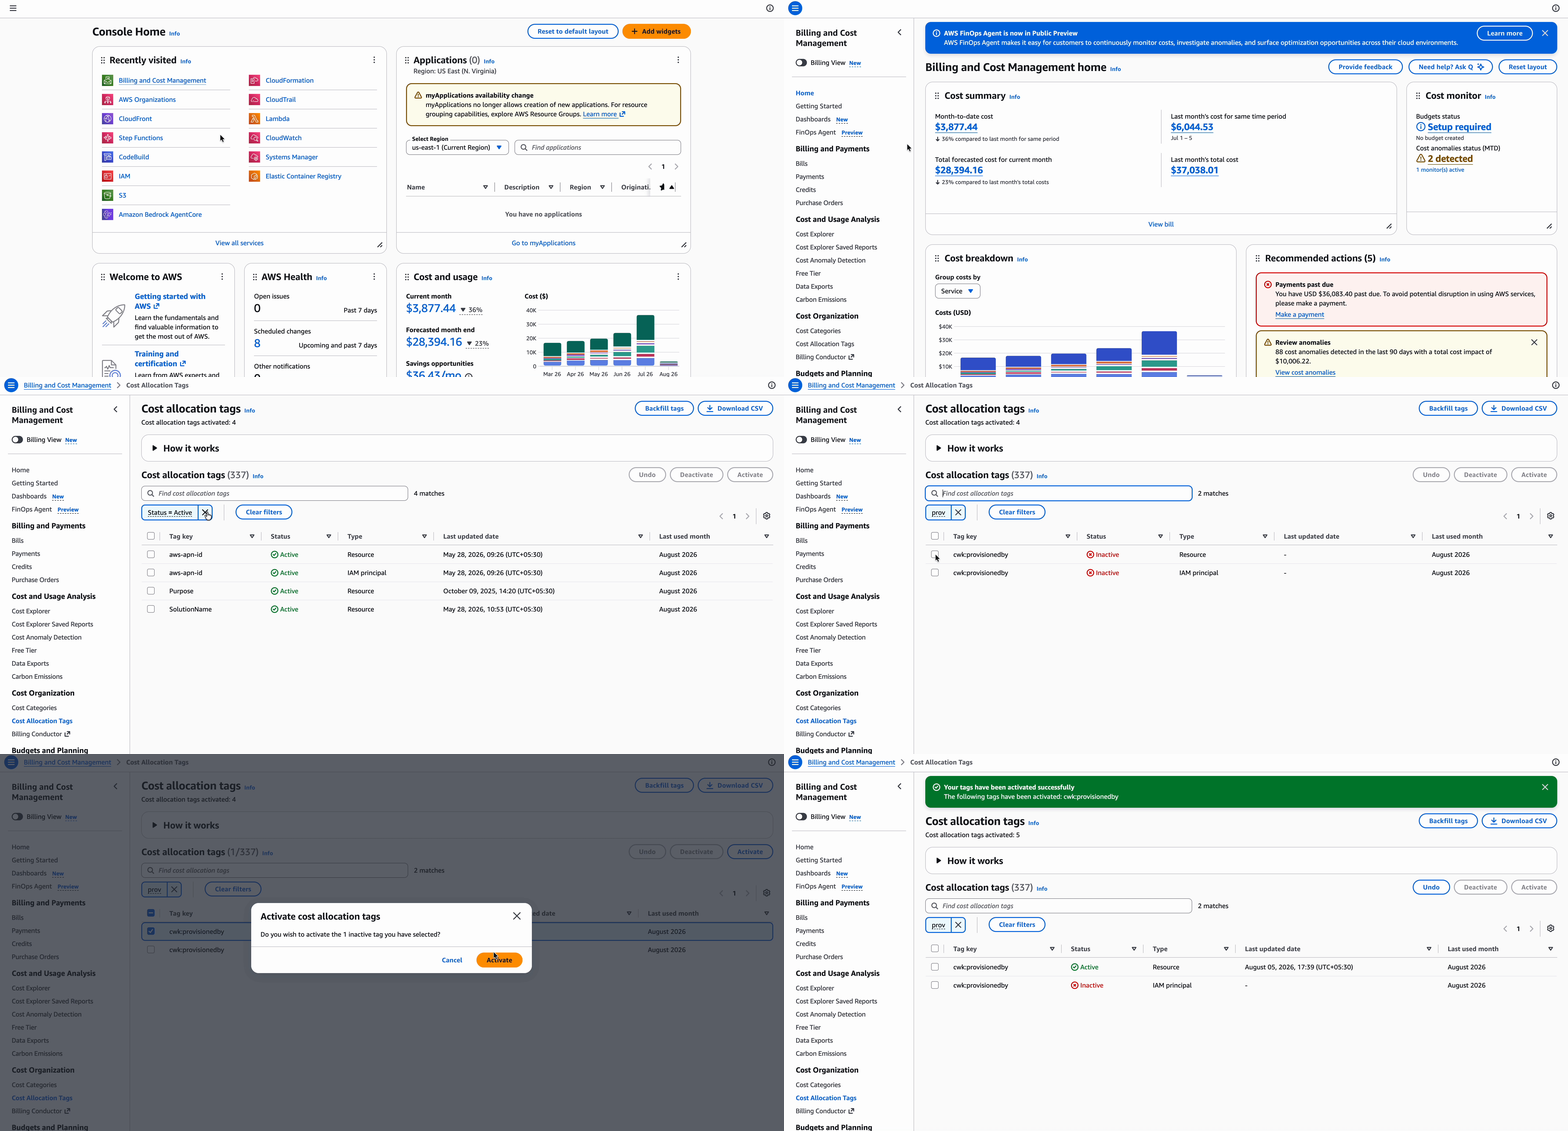
To accurately calculate Estimated Amorphic costs, the cwk:provisionedby AWS cost allocation tag must be activated in the AWS management account. If the tag is not enabled, Estimated Amorphic Infrastructure Cost, Estimated Amorphic Application Cost and Estimated Amorphic Cost metrics may be incomplete or unavailable.
How to Enable the Cost Allocation Tag
Follow these steps in the AWS Billing Console to activate the tag:
- Sign in to the AWS Management Console using the management account.
- Navigate to AWS Billing and Cost Management.
- In the left navigation pane, select Cost Allocation Tags.
- Search for the
cwk:provisionedbytag in the list. - Select the checkbox next to
cwk:provisionedbyand click Activate.
Accessing Cost Management
- From the Trace navigation bar, select Cost Management.
- The module opens on the Overview tab by default.
- Select the Cost Explorer tab to perform more detailed cost analysis.
Overview
The Overview tab provides a consolidated view of cloud spending through a set of dashboards and visualizations, making it easier to monitor spending patterns and quickly identify major cost drivers.
Cost Summary
The summary cards display the current month-to-date AWS Cost and Estimated Amorphic Cost, providing an immediate snapshot of overall cloud expenditure. This allows spending across the entire AWS account and Amorphic-managed resources to be reviewed at a glance before exploring more detailed reports.
Cost Growth Trend
The chart compares monthly AWS Cost and Estimated Amorphic Cost across the previous six months together with the current month-to-date. This visualization helps identify long-term spending patterns and makes it easier to recognize changes in overall cloud expenditure.
Current vs Forecasted Monthly Cost
This section compares the actual cost incurred from the start of the current month through today with the forecasted cost from today through the end of the month. Separate comparisons are shown for both AWS and Amorphic, providing visibility into current spending relative to projected month-end costs.
Current vs Forecasted Daily Cost
The chart displays the actual daily cost recorded through today alongside the forecasted daily cost from today until the end of the current month. A marker highlights the current day. The cost source can be switched between AWS and Amorphic to compare daily spending patterns.
High Costing Resources
The chart highlights the top five cost-contributing resources over the previous seven days. Costs can be viewed for AWS, Amorphic, Amorphic Infrastructure, or Amorphic Application, helping identify the individual resources responsible for the highest recent cloud expenditure.
Cost by Service
The chart breaks down Estimated Amorphic resource costs by the AWS services they consume, such as Amazon S3, Amazon OpenSearch Service, AWS Lambda, and Amazon DynamoDB, across the previous three months and the current month-to-date. It helps identify the services contributing most to overall Estimated Amorphic costs.
Refer to the overview demonstration below to explore the dashboard layout and interactive components:
