Overview
Dashboards provide a personalized and powerful way to access key features, monitor data, and track activities related to your tasks, datasets, and other resources within the application. They offer a centralized view, allowing you to quickly understand the state of your data and infrastructure. When you first log in, you'll be greeted by your default dashboard. This dashboard is pre-configured to provide a general overview of your data and resources.
For regular users, the dashboard displays the following charts:
For admin users, the dashboard displays the following charts:
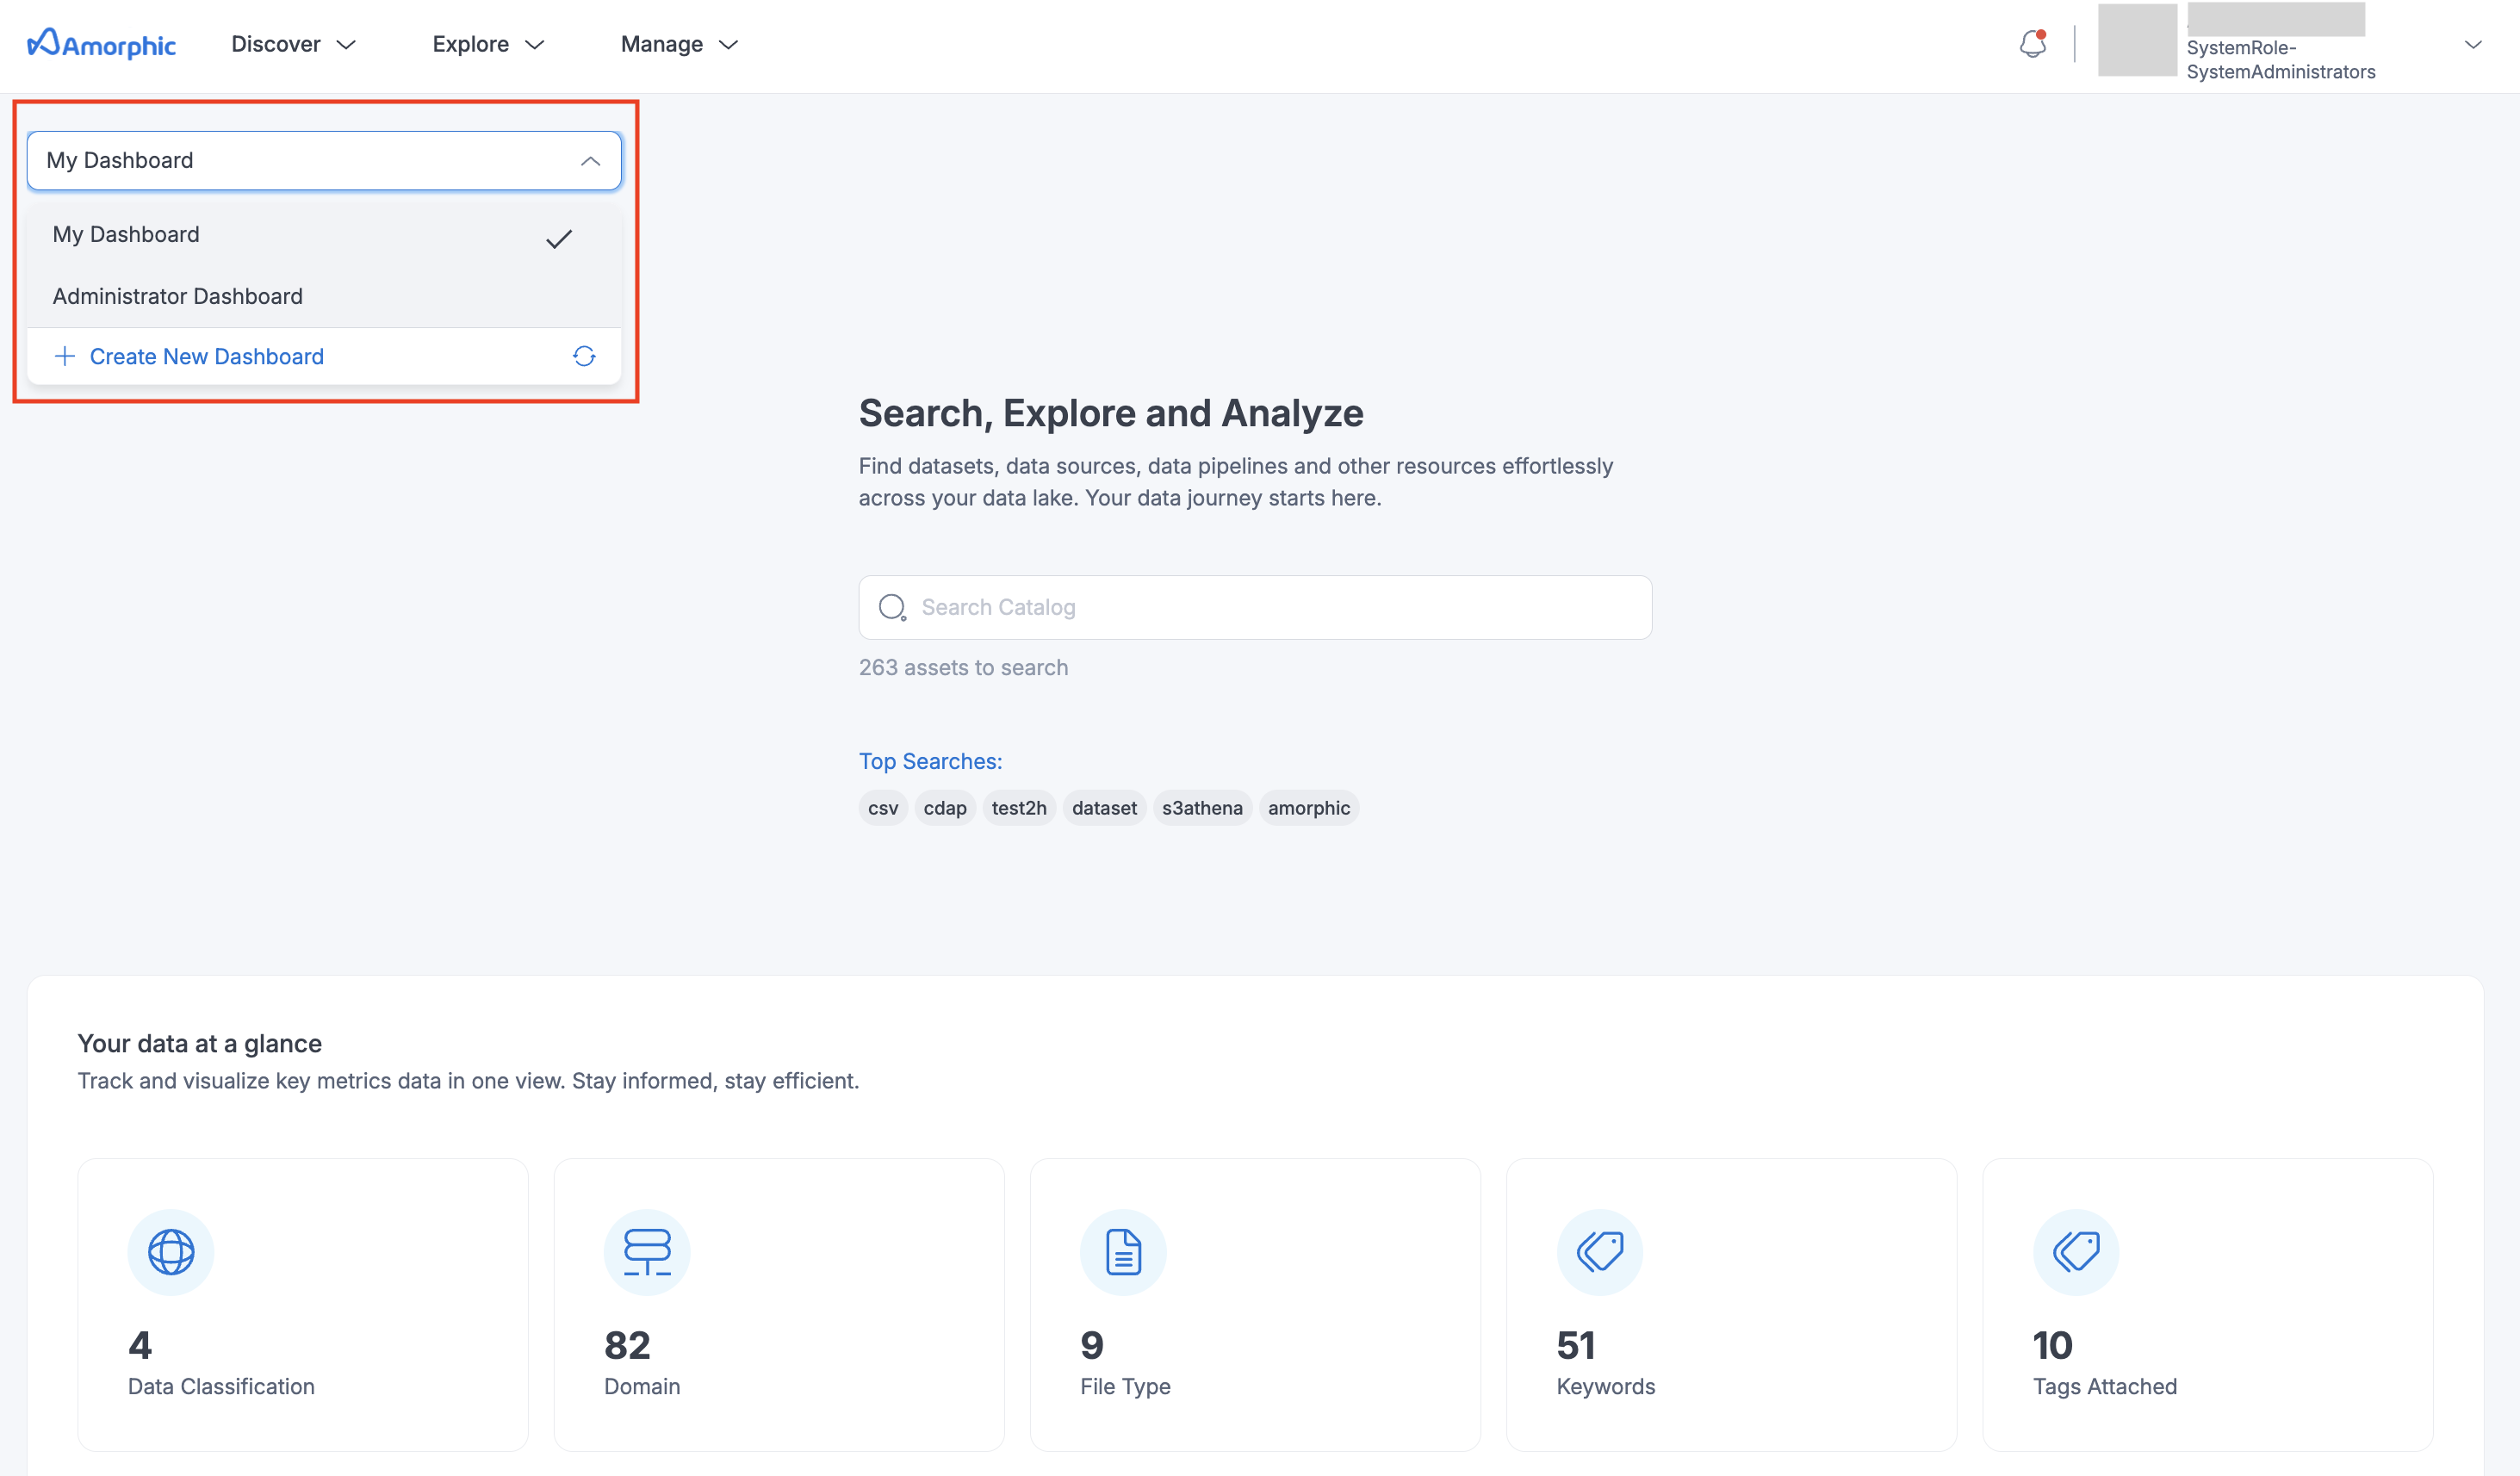
Users can create custom dashboards as per their preference and switch between them.
How to create a custom dashboard?
To organize related information and conveniently access it, you can construct multiple dashboards and toggle between them on the home page. To create a dashboard, follow the outlined steps and the accompanying GIF:
- Locate the Dashboards icon located at the top right corner of your screen.
- Select the
Create New Dashboard(plus icon) option. - Provide a descriptive name for your dashboard.
- Browse the available widgets from the provided list and select the ones that best suit your needs.
- Customize the selected widgets by modifying their attributes as required.
- Once all the desired widgets have been added, click the “Save” button to finalize the dashboard creation.
Widgets
A dashboard is built up using widgets. Each widget will show you the relevant information in a graph or other visual formats. By using widgets, you can easily track the following features:
| Attribute | Description |
|---|---|
| Access Requests | List of Access requests for datasets access, both sent and received |
| Billing Details | Current and Estimated usage stats for the current month |
| Catalog Search | Search for amorphic resources in the catalog |
| Dataset Lineage | To track the dataset journey |
| FlexiQuery | Quick query to run on your data |
| High Costing Resources | List of all High costing resources in the application |
| Quick Links | Any links within and/or outside the application |
| Quick Sight Dashboard | Render a QuickSight dashboard you have access to |
| Recent File Loads | Recent and current file load executions count |
| Resources Cost | To check the cost of resources per day |
| Resources Count | Check the count of resources per server over time |
| System Health | Track system health status for each service |
| Insights Details | Track the status of various resources within the Amorphic platform |
Insights widget provides a brief overview of recent execution history and the associated status for the following supported resources:
Jobs | Dataset Metrics | Data Pipelines | Dataflow Runs for a JDBC Bulkload Datasource
Limitations:
- Maximum of 10 execution records shown per resource
- For Full-Load-CDC and CDC type of Bulkload Dataflow Runs, only the most recent execution status is displayed
To select a different dashboard, you can use the drop-down list as shown in the image below.