
Dashboard
Introduction
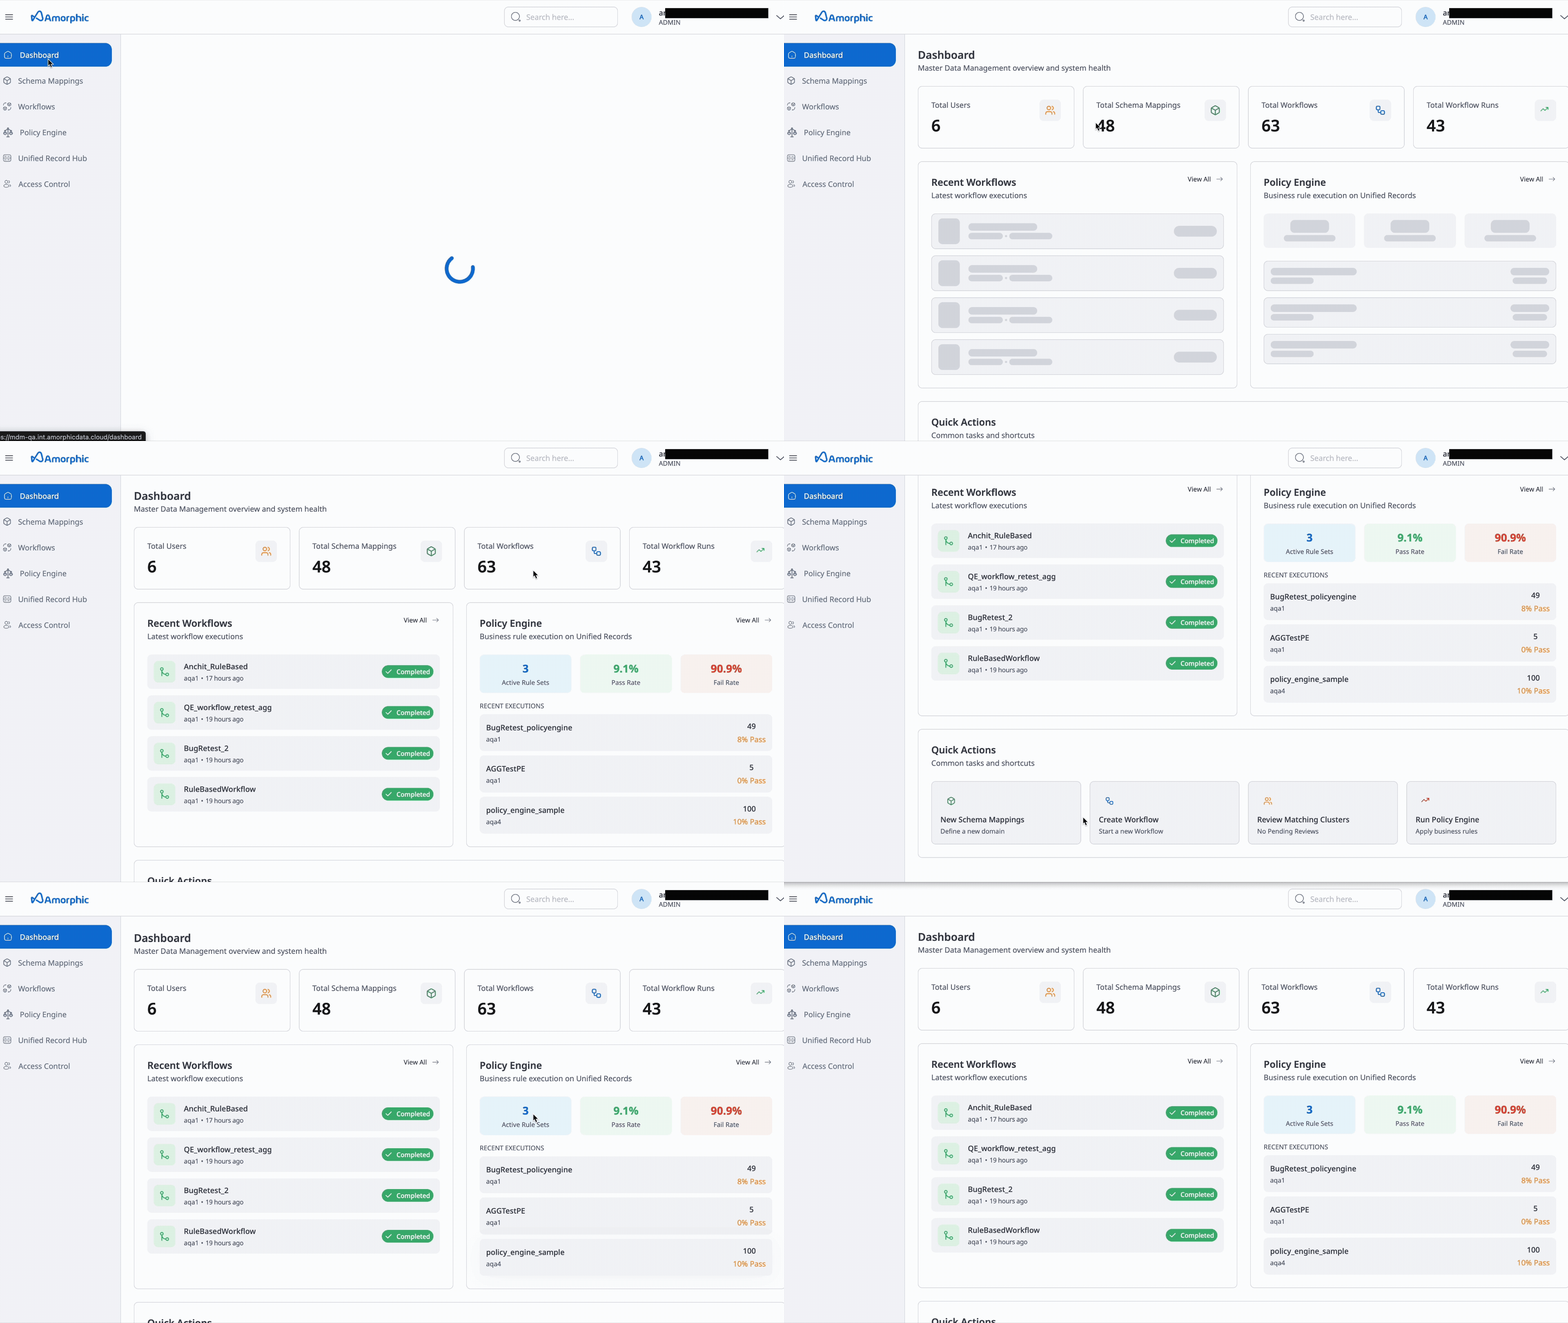
The Dashboard is the landing page for the MDM application. It gives you an at-a-glance view of Master Data Management health, platform activity, stewardship throughput, and your personal workspace—and provides quick access to common tasks.
Metrics on the Dashboard are maintained as workflows and Policy Engine runs complete and as stewards approve, flag, or override records. Charts and tiles therefore reflect pre-aggregated summaries, so the page stays responsive even when unified master record volumes are large.
The Dashboard has two tabs:
- Overview — Platform KPIs, activity trends, stewardship snapshot, workspace, recent workflows, and Decisioning Engine highlights
- Stewardship — Review throughput over a date range and the reviewer leaderboard
Platform-wide summary tiles (for example Total users) are visible to Administrators. Other roles still see activity they can access, including My workspace, recent runs, and quick actions where permitted.
Overview
Platform summary tiles
The top row summarizes the MDM estate:
| Tile | What it shows |
|---|---|
| Total users | Registered users on the platform (with period change where available) |
| Schema mappings | Count of schema mappings (entities) |
| Workflows | Total ER workflows, including Active and Failed counts |
| Policy engines | Count of Policy Engine (decisioning) rule sets |
| Workflow runs | Cumulative ER workflow executions (with comparison to the previous period) |
Platform activity
The Platform activity chart compares Input records processed by ER workflows with Golden created (unified master records) over time.
Use the chart controls to:
- Time range —
24h,7d,30d,90d, or Custom (date picker) - Granularity — Hour, Day, or Month
- Series mode — Discrete (per-bucket values) or Cumulative
Click a time bucket on the chart when available to open related executions for that window.
Record and execution KPIs
A second row of tiles focuses on mastered data volume and compute:
| Tile | What it shows |
|---|---|
| Total golden records | Lifetime unified master records created across workflows |
| Total published | Golden records that have been published (also shown as a share of total golden) |
| Total pending review | Records still awaiting stewardship in Unified Record Hub |
| Workflow execution hours | Cumulative ER run time (with average hours per run when available) |
| Policy engine execution hours | Cumulative Policy Engine run time (with average hours per run when available) |
Stewardship snapshot
The stewardship snapshot summarizes lifetime (or recent) review outcomes:
- Approval rate across reviewed records
- Breakdown of Approved, Flagged, and Overrides
- Top reviewers with review counts and accuracy indicators
Open the Stewardship tab for date-filtered throughput and the full reviewer leaderboard.
My workspace
My workspace is scoped to the signed-in user and shows resources and activity you own or can access, for example:
- Entities (schema mappings)
- ER workflows and their Runs
- Decisioning (Policy Engine) rule sets and their Runs
- Exec hours for your runs
Workspace counters are created on the first write for each resource type. New users may see zeros until they create or run workflows and Policy Engine rule sets.
Recent workflows
Lists the latest ER workflow executions with status badges such as Completed, Running, and Failed, plus relative timestamps. Use View all to open the full workflow run history.
Decisioning Engine
Summarizes Policy Engine (business-rule) activity on unified master records:
- Active rule sets
- Aggregate Pass rate and Fail rate
- Recent executions by rule set (domain, records processed, pass percentage)
Quick actions
Shortcuts at the bottom of Overview jump into common tasks:
- New Entity — Create a schema mapping / domain entity
- Create Workflow — Start a new ER workflow
- Review Clusters — Open pending stewardship reviews (badge shows backlog when available)
- Run Decisioning — Run a Policy Engine rule set
These actions help Data Engineers, Data Stewards, and Admins move from the overview into the task they need.
Stewardship
The Stewardship tab focuses on review velocity and reviewer productivity.
Review throughput
Select a start and end date to see:
- Totals for Reviewed, Approved, Flagged, and Overrides in the window
- A by-day series of the same measures (when a date range is applied)
Reviewer leaderboard
Lists reviewers with lifetime (or cumulative) counts for reviewed, approved, flagged, and override actions. The list supports pagination when many stewards are active—load the next page when more results are available.
Stewardship metrics update when users approve, flag, or override records in Unified Record Hub. Platform and workflow backlog tiles (Published, Pending review) move in the same way as review actions complete.